Day 2: Mapping walls you can’t see from above. 🧗♂️
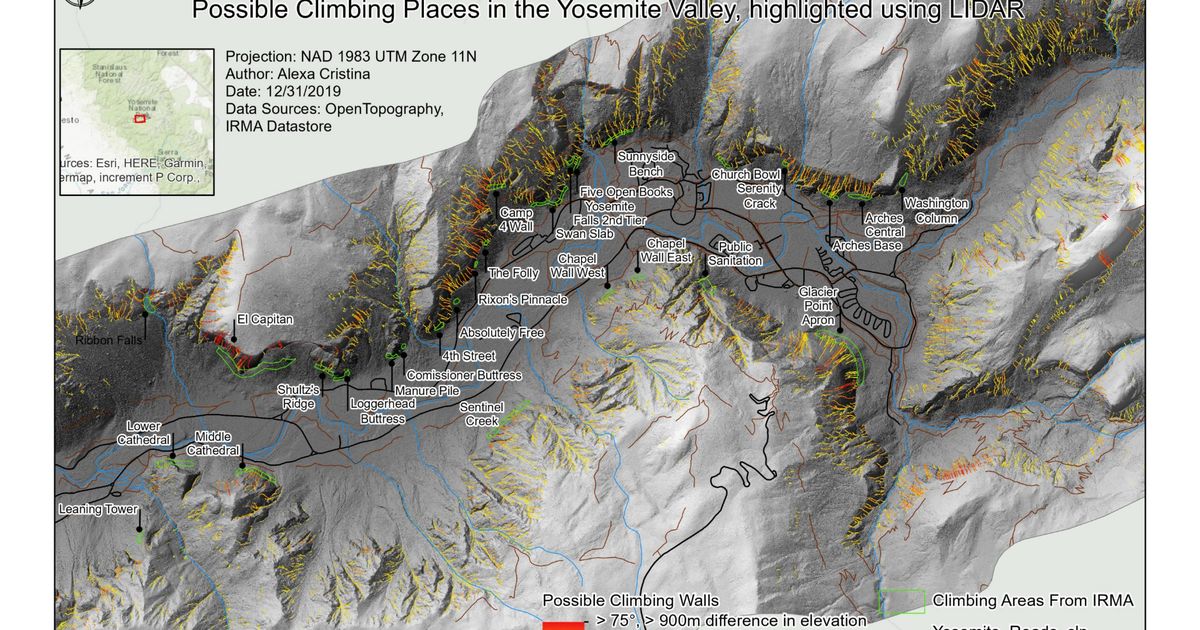
Yosemite Valley. Climbers need to understand vertical terrain, but most maps show the world from a bird’s perspective. I used airborne LiDAR at 0.5 meter resolution to create a Digital Terrain Model, then extracted climbing walls by slope analysis, focusing on areas steeper than 75 degrees clustered into routes.
I used flow direction algorithms to estimate wall heights by measuring elevation differences along main flow paths crossing each wall, then classified them by steepness and length. Yellow to red gradients represent everything from 45° walls over 100 m to extreme 75° faces exceeding 900 m.
The challenge wasn’t the 3D model. It was LiDAR occlusion on overhangs. LiDAR can’t see the exact features climbers care about most. 🏔️ So this map shows possibility, not certainty. It highlights known climbing areas and suggests new ones, while the rest requires boots on rock.
Some questions need both data and dirt.
Read more (2017 write-up): Yosemite climbing walls from LiDAR
The project
This work grew from a master’s thesis question: can high-resolution terrain data reveal climbing walls that top-down maps never show? Yosemite Valley was the test case: El Capitan, Half Dome, Cathedral Rocks, and the vertical geology that draws climbers from Camp 4 and beyond.
Airborne LiDAR at 0.5 m resolution builds a Digital Terrain Model fine enough to preserve steep faces. Coarser DEMs smooth slopes and shorten apparent wall lengths; here, resolution was the constraint that made 75° thresholds meaningful.
Analysis pipeline
| Step | Method | Output |
|---|---|---|
| DTM | Airborne LiDAR → raster surface | 0.5 m terrain model |
| Slope | Morphologic surface analysis | Steep areas > 75°, clustered into wall zones |
| Height | Flow direction along paths crossing each wall | Elevation difference = wall height proxy |
| Classification | Slope + length combined | Yellow → red: 45° / 100 m up to 75° / 900 m |
| Suitability (extra) | Overlay roads, rivers, springs, parking | Subjective “best place” layer |
Tools in the original workflow included PDAL, ArcGIS, Python, and QGIS for processing scripts, maps, and charts.
LiDAR occlusion – the honest limit
Airborne LiDAR looks downward. Overhangs, recesses, and features undercut from above fall into a shadow zone the sensor never reaches. The map does not claim ground truth for every route geometry. It shows where steep, long faces likely exist, and where field verification still matters.
That is why the closing line holds: some questions need both data and dirt.
How to follow
- Blog: blog.maptheclouds.com
- LinkedIn: Day 2 post
- 2017 article: Yosemite climbing walls
- Previous: Day 1 – Aiudului Gorges
- Hashtag: #100DayMapChallenge
#100DayMapChallenge · Day 2/100 · Yosemite LiDAR · LinkedIn
Previous: Day 1: The Map That Started Everything