Well.. No, it isn’t, but it rocks, too! 😀
Ok, enough with the corny jokes. This post is about Yosemite Valley, a ~1-km-deep, glacially carved canyon in the Sierra Nevada mountains of California, that hosts some of the largest granitic rock faces in the world, and also spires and peaks like The Sentinel (Sentinel Rock) and Cathedral Spires.
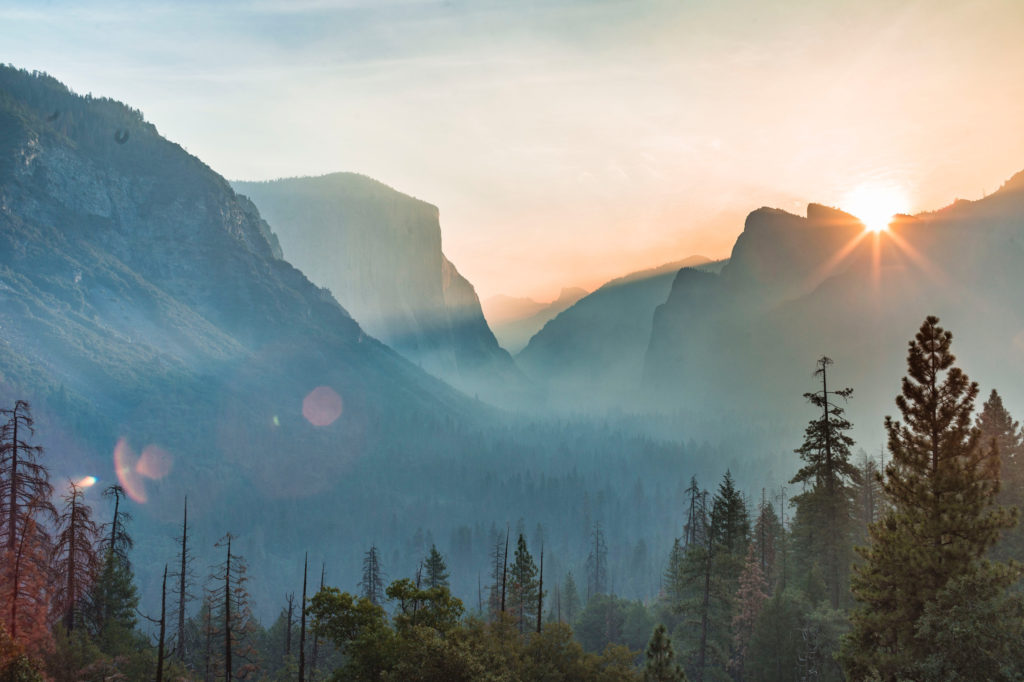
Photo by Bailey Zindel on Unsplash
I was writing in September about the opening season of MOOCs (Massive Open Online Courses). Most of them are free, but it’s a trap, you can end up wanting to follow the whole specialization (and pay for it), and so I did. 🙂 On Thursday I have ended a GIS specialization on Coursera.
ESRI‘s suite of products was used in the courses, but the knowledge is software agnostic, I wanted to refresh the GIS notions from my cartographer era, and this guided courses helped me. I don’t know if the certification would help me in any way, but who knows. I must admit ESRI has very useful resources for learning, I like ArcGIS, but I will use QGIS in real-life projects, it is free and open-source, and supported by a great community.
For the final project, I chose to study the climbing walls in Yosemite Valley, where Camp 4 is regarded as the birthplace of modern rock climbing. Mostly because I wanted to dig into LiDAR and play with PDAL and Entwine, and I expected to get some cool visualizations of El Capitan (1000 m high) and Half Dome (1443 m) using data at 0.5 m resolution. 😊

Airborne LiDAR system schematic (Source: http://gmv.cast.uark.edu/scanning2/airborne-laser-scanning/)
I didn’t get the cool visualizations, because I would have needed high resolution photos or LiDAR data collected from the ground, and ArcScene is not quite the best 3D art tool. But I’ve proved, based on walls declivity and length, that the best climbing wall in Yosemite is on El Capitan. 😏
Usually in a GIS project, you ask a question related to a problem that concerns the clients, then try to answer it and solve the problem. My questions were ‘Where are the possible climbing walls in Yosemitte Valley’ and ‘Where is the longest climbing route in less than 500 m from the main road, and no more than 100 m from a trail’, and the answers would (teoretically) help climbers to better understand the existing climbing environment and discover possible new climbing areas.
Off the record, I’m sure climbers going to Yosemite don’t need a map of the walls to find their long planned routes, and this project must not be considered a climbing guide, but it was a good opportunity to peek to the climbing goodies in Yosemite Valley and do some GIS analysis, too.
Geospatial Analysis Project
Long story short, I have delineated the Yosemite Valley climbing walls starting by creating a high resolution Digital Terrain Model (0.5m), from LiDAR (Light Detection and Ranging) data captured using Airborne scanning.
LiDAR is a remote sensing technique that uses visible or near-infrared laser energy to measure the distance between a sensor and an object. The sensors can be terrestrial (on tripod), airborne (plane), mobile (car) and unmanned (drones).
Digital Elevation Model (DEM) is a topographic surface arranged in a data file as a set of regularly spaced x, y, z coordinates where z represents elevation. The term Digital Surface Model (DSM) represents the earth’s surface and includes all objects on it. In contrast to a DSM, the Digital Terrain Model (DTM) represents the bare ground surface without any objects like plants and buildings.
I have downloaded free point cloud data from OpenTopography, and also free and complete GIS data for Yosemite National Park from IRMA (Integrated Resource Management Applications) Datastore, and inspected the region using NAIP (National Agriculture Imagery Program) aerial data. You can find very thorough data, it is nice that we have access to them for free, even from worldwide. I would probably have made a project on Aiudului Gorges or Piatra Craiului Mountains instead of Yosemite Valley, but we don’t have the luxury of free GIS or LiDAR data yet, here in Romania.
I have used PDAL to merge the files, reproject to the same coordinate system, create tiles, extract ground points and denoise the tiles using a series of commands in batch. Then I went to ESRI’s ArcMap 3.7, imported all resulting ground tiles to a new LAS dataset and continued the analysis.
ArcGIS is a geographic information system (GIS) for users/organizations to create, manage, share, and analyze spatial data. It consists of server components, mobile and desktop applications, and developer tools.
PDAL, Point Data Abstraction Library, is a C/C++ open source library and applications for translating and processing point cloud data.
From the 3D model, I have derived raster image files and extracted the climbing walls: outlined the morphologic characteristics of the ground surface (slope), identified the areas with steep slope above 75° and created a cluster of similar zones using raster image generalization algorithms.
Also, I have determined the walls length using a flow direction and stream identification algorithms to obtain the main flow lines that cross a wall, and calculating the difference in elevation for each. With the slope and length data, I’ve classified the climbing walls by steepness and length, for example from yellow to red (> 45° and > 100m difference in elevation, > 75° and > 900m difference in elevation).
Finally, the project describes an extra suitability analysis in which I’ve overlaid subjective criteria (distance to roads, rivers, springs, parking) and morphometrical criteria (slope, length) to find out the best climbing wall.
Not surprisingly, the best climbing wall turned out to be El Capitan, the almost 1km length of the wall and the above 75° steepness have had a big weight in the final overlay model. The coordinates of the resulting point are 37.730285, -119.637618 decimal degrees.

climbing walls 
geology 
best wall 
walls repartition 
slopes percentage 
slopes area 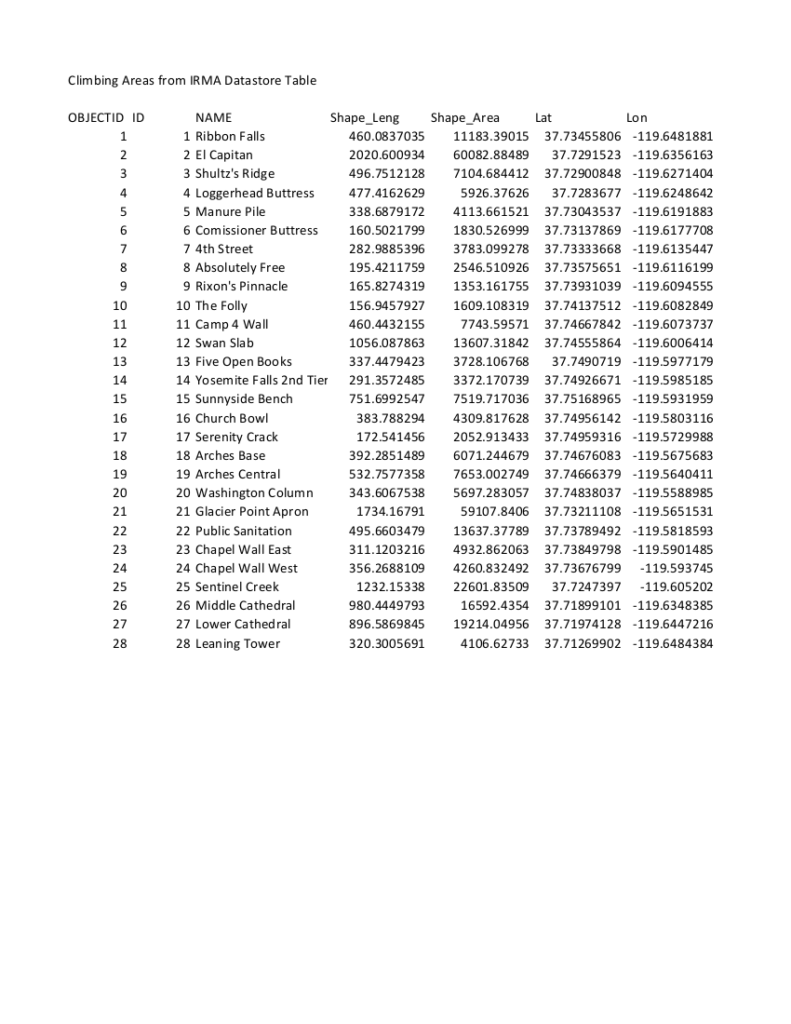
Climbing areas table 
legend 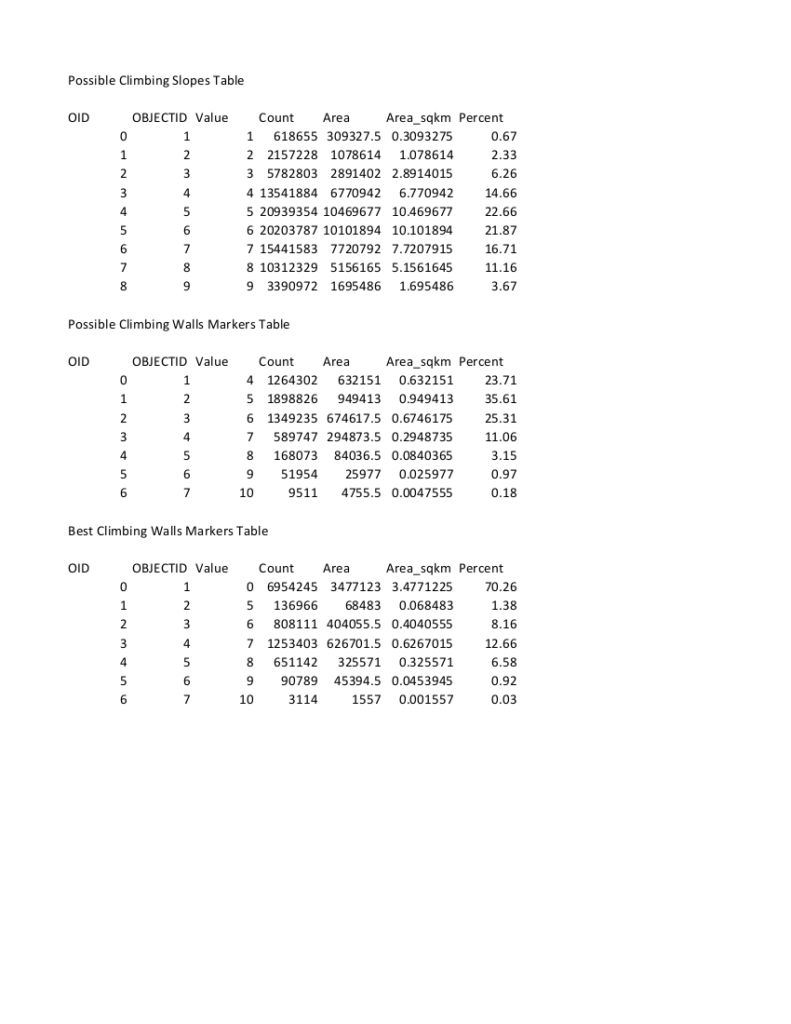
raster tables 
possible climbing slopes

There are still many methods to refine the analysis results and define the climbing walls or to obtain the wall length, correlated with on-site analysis. The project does not analyze the climbing walls in detail, because there is a lack of data from the ‘shadow’ effect that occurs when data is being collected from above the cliffs and overhangs (LiDAR data from the ground, or high resolution photos would be more useful for this kind of analysis). However, the overall result gives a better overview on the existing climbing areas and highlights possible new climbing areas, proving that LiDAR is a valuable resource that can be used with success to examine the surface morphology.
Regarding the online GIS specialization from UC Davis, Nick Santos is a great teacher and the learning materials were interesting and diverse. Only one thing bothered me, every time there were peers that gave lower grades without reason. There was one amusing incident, too, when a peer copied my map pdf and overlaid his name. Some people never grow old. 😂
What else? I would have done another 3D view in Blender using the DTM and aerial imagery, a map for the project using ArcGIS API for JavaScript, and a dedicated page for the project.. I would like to obtain the elevation model in PDAL, too, and the other steps using QGIS. I would like to colorize the point cloud from the aerial imagery and visualize it in Potree. Homework 😉
Web and Print Map Creation
Here are the links to the pdf files, and below the embedded versions: Executive Summary, Final Maps, Final Project Analysis.
Executive Summary [pdf-embedder url=’http://blog.maptheclouds.com/wp-content/uploads/2020/01/Climbing-Yosemite-Valley-Executive-Summary.pdf’]
Final Maps [pdf-embedder url=’http://blog.maptheclouds.com/wp-content/uploads/2020/01/Climbing-Yosemite-Valley-LiDAR-Maps.pdf’]
Final Project Analysis (extended Summary of Results) [pdf-embedder url=’http://blog.maptheclouds.com/wp-content/uploads/2020/01/Climbing-Yosemite-Valley-Final-Analysis.pdf’]
The geeky scientist part of me thought that a Summary of Results was not enough, so the final analysis looks now like a pseudo-academic paper (with bonus grammar mistakes and mixed fonts). 🙂
Here is a link to the ArcGIS Online version of the map, at lower resolution, and below an attempt to embed it in WordPress.
[webmap id=”5ec61a12406f4c49b9d00d146a657dd0″ height=500 width=1024 zoom home scale legend basemap_toggle basemap_gallery details]
More resources? Here they are:
- Yosemite’s Iconic El Capitan Mapped in High-Res 3-D
- Yosemite Google Street View
- Free Solo: Who’s the ‘El Capitan’ Now?
- National Park Service Rock Climbing Guide
- Climbing Map of Yosemite National Park
- Yosemite Valley Climbing Routes
- Yosemite’s Best Free Climbing Routes
- Yosemite National Park Rock Climbing Routes
- Climbing in Yosemite
- El Capitan 3D Model