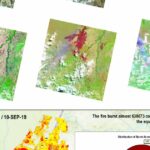
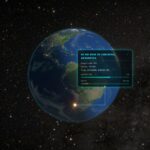
• Skip to main navigation
  • Skip to main content
  • Skip to footer
MapTheClouds

MapTheClouds

GIS playground, 3D maps and data visualizations

  • About me
  • Home
  • Skip to menu toggle button

Category: Maps

Styling elevation models in QGIS – Blue scale 🔷

Posted on: February 1, 2022 Last updated on: February 16, 2022 Written by: MapTheClouds Comments: 0
#30DayMapChallenge Day 8. Blue Blue scale 🔷 In this post, I’ll talk a bit about styling elevation models in QGIS, giving as an example one of the maps I have made for the #30DayMapChallenge on Twitter in 2021. You can…
Continue reading “Styling elevation models in QGIS – Blue scale 🔷”…

Autumn 🍂

Posted on: January 20, 2022 Last updated on: September 18, 2023 Written by: MapTheClouds Comments: 0
#30DayMapChallenge Day 2. Lines Autumn – coloring streams by their flow order in QGIS 🍂 Here’s one of the maps I have made for the #30DayMapChallenge on Twitter in 2021. You can find out more about the challenge and my…
Continue reading “Autumn 🍂”…

OSM buildings vector tiles in D3.js – City Tiles 🏙️

Posted on: January 20, 2022 Last updated on: September 18, 2023 Written by: MapTheClouds Comments: 0
#30DayMapChallenge Day 3. Polygons City Tiles 🏙️ This is a OSM buildings vector tiles map made using D3.js and Nextzen, that I have prepared for #30DayMapChallenge on Twitter in 2021. You can find out more about the challenge and my…
Continue reading “OSM buildings vector tiles in D3.js – City Tiles 🏙️”…

3D globe map in D3.js – Populated Places on Earth 🌍

Posted on: January 20, 2022 Last updated on: February 16, 2022 Written by: MapTheClouds Comments: 0
#30DayMapChallenge Day 1. Points Populated Places on Earth 🌍 This is a 3D globe map in D3.js and Canvas, that I have made for the #30DayMapChallenge on Twitter in 2021. You can find out more about the challenge and my…
Continue reading “3D globe map in D3.js – Populated Places on Earth 🌍”…

My #30DayMapChallenge 2021

Posted on: January 20, 2022 Last updated on: January 25, 2022 Written by: MapTheClouds Comments: 0
Here’s a story about my #30DayMapChallenge 2021. I have a special talent of delaying my favorite projects. I love making maps, and during all those years at work I have digitized miles and miles of roads, solved thousands of bugs,…
Continue reading “My #30DayMapChallenge 2021”…

COVID-19 in Romania – a graph

Posted on: January 13, 2021 Last updated on: February 6, 2021 Written by: MapTheClouds Comments: 0
This post is about the visualizations I’ve made on COVID-19 in Romania, and about data visualization in general.If you are in a hurry, you can go straight to the graphs. Well, 2020 was challenging, and changed many people’s lives. It…
Continue reading “COVID-19 in Romania – a graph”…

30daymapchallenge ANCPI ArcGIS blue channels Climbing data DTM earth El Capitan Elections Elevation globe hidrology Hillshade interaction LiDAR Maps mapshaper Nextzen OSMBuildings PDAL QGIS river Slope Spatialite VectorTiles Weighted Overlay Yosemite Valley

  • Epic fails
  • Events
  • Learning
  • Maps
  • Random
  • Resources
  • Tutorials

  • November 2022
  • February 2022
  • January 2022
  • November 2021
  • January 2021
  • December 2020
  • March 2020
  • February 2020
  • January 2020
  • December 2019
  • November 2019
  • September 2019

Follow Me

Contact Me

  • speakup@maptheclouds.com
  • Română
  • English
© 2021 MapTheClouds | Using Reykjavik theme. | Back to top ↑
Scroll Up