
Day 28. Migration flows across borders 🌍
How do you represent movement when every country is both a source and a destination?
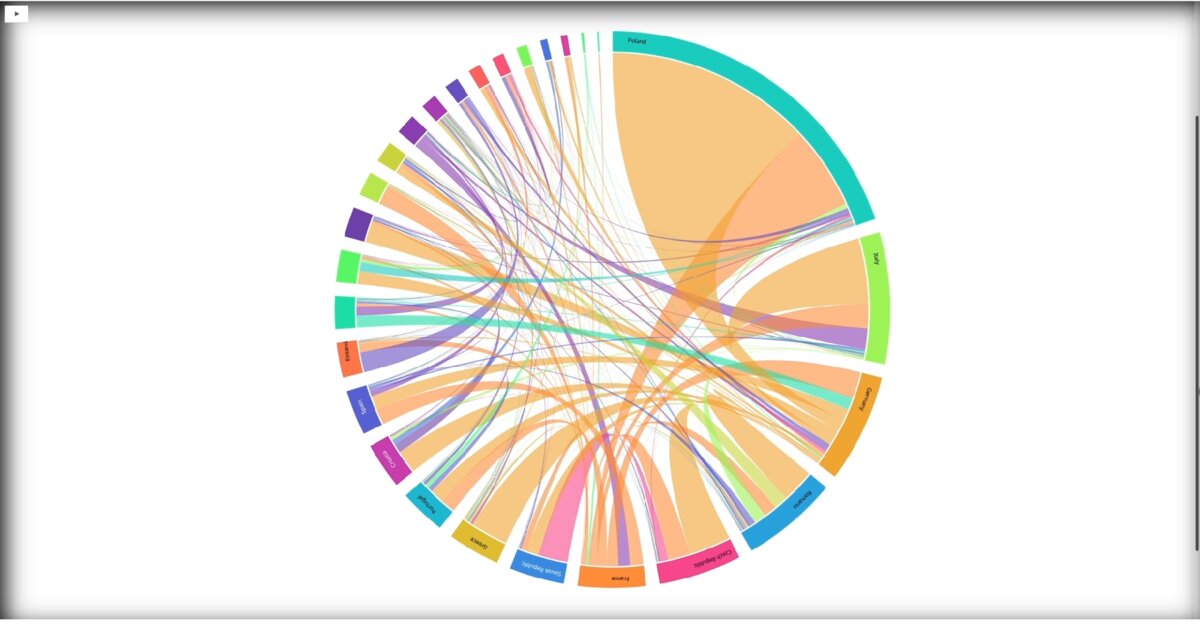
This visualization shows bilateral migration flows within the European Union in 2020. Each ribbon represents movement between two countries, with thickness indicating volume. Countries are ordered by total migration activity. Poland and Italy stand out as major sources, while Germany and France appear as major destinations. Yet every country participates in both directions. Migration is bidirectional and asymmetric.
I used a chord diagram, a layout suited for many-to-many relationships where both direction and magnitude matter. The main challenge is visual density. As connections increase, readability drops quickly, so ordering and consistent color become structural decisions, not aesthetic ones.
European mobility is not a simple east-to-west story. It is a dense web of exchanges shaped by opportunity, economics, language, and history.
Live demo: EU migration chord (multivariate)
The project
| Piece | Role |
|---|---|
| Layout | Chord diagram |
| Encoding | Ribbon thickness = volume; order by activity |
| Insight | Bidirectional and asymmetric, not one corridor |
| Hard part | Density: order and color as structure |
How to follow
- Blog: blog.maptheclouds.com
- LinkedIn: Day 28 post
- Live demo: EU migration chord (multivariate)
- Previous: Day 27: Star Map First Experiment
- Hashtag: #100DayMapChallenge
#100DayMapChallenge · Day 28/100 · LinkedIn
Previous: Day 27: Star Map First Experiment