
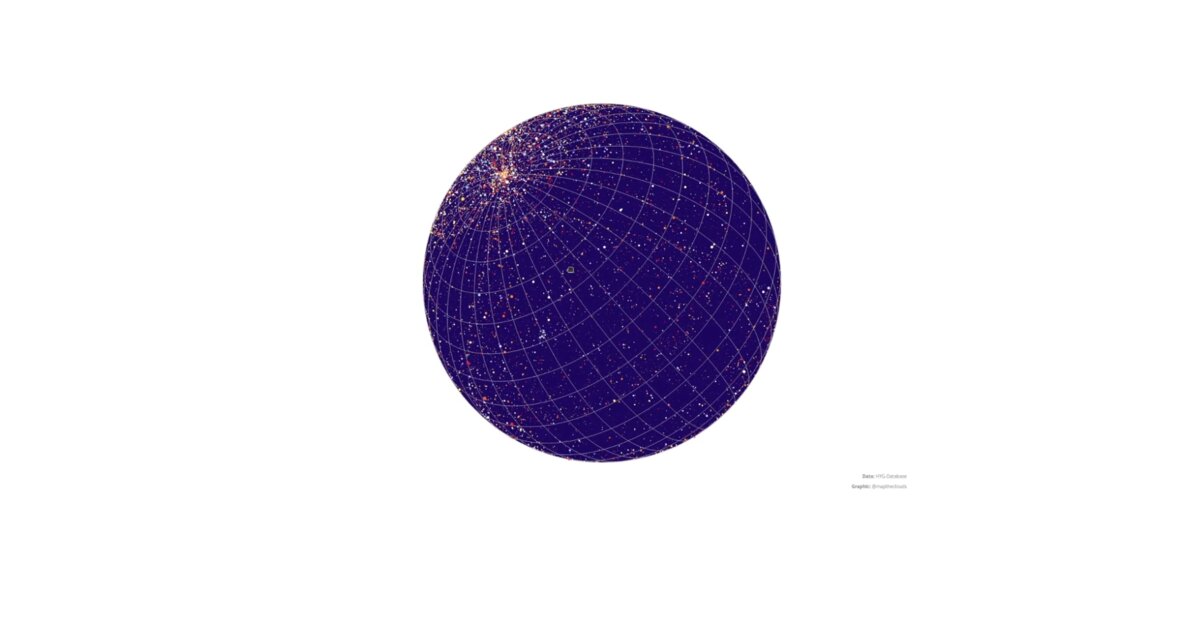
Day 27. First experiment with star maps 🌌
This is where it started: a simple globe built from the HYG star database. Each point represents a star, sized by perceived brightness. I limited the dataset to stars brighter than magnitude 8 to preserve legibility and avoid overwhelming the spatial structure.
The technical approach was intentionally minimal. D3 handled data processing and coordinate transformation, Versor managed the rotation, and rendering stayed lightweight. No atmospheric effects, no cinematic transitions. Just celestial coordinates plotted on a sphere, with size reflecting how bright each star appears from Earth.
It was one of my first attempts at exploring spatial visualization beyond geography. Not continents and borders, but constellations and magnitude scales. It raised a different kind of question: how do we represent distance and scale when reference points are measured in light-years?
The project was basic, but it stayed with me. I kept returning to the idea, gradually adding motion, sound, and more deliberate camera paths. That later version was longlisted at the Information is Beautiful Awards. You’ll see it on Day 57.
Sometimes an early technical constraint becomes the foundation for deeper work later.
Live demo: Relationships / space (star globe)
The project
| Piece | Role |
|---|---|
| Data | HYG, magnitude brighter than 8 |
| Stack | D3 processing + Versor rotation |
| Scope | Minimal: no atmosphere, no cinematic FX |
| Later | Day 57 Information is Beautiful longlist |
How to follow
- Blog: blog.maptheclouds.com
- LinkedIn: Day 27 post
- Live demo: Relationships / space (star globe)
- Previous: Day 26: SIRUTA Sunburst
- Hashtag: #100DayMapChallenge
#100DayMapChallenge · Day 27/100 · LinkedIn
Previous: Day 26: SIRUTA Sunburst