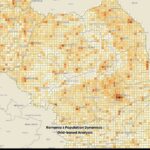
Day 29: Romania population as a Gridviz mosaic. Density without administrative borders. Week 5 begins. #100DayMapChallenge.
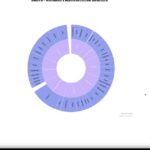
Day 26: Breaking Down a Nation – SIRUTA Sunburst
Day 26: Romania administrative hierarchy as a zoomable sunburst (SIRUTA). Area = population. #100DayMapChallenge.
Day 22: COVID Network by County – Relationships and Geography
Day 22: Who infected whom, and where? County-grouped COVID network for Romania. #100DayMapChallenge.
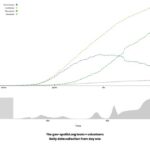
Day 21: COVID-19 Daily Cases in Romania – Case Number One
Day 21: Romania case one, Feb 26 2020. Interactive timeline from geo-spatial.org open data. Start of the COVID series. #100DayMapChallenge.
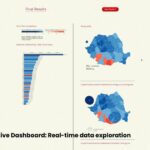
Day 11: When Geography Lies About Votes – Romania 2019 Cartograms
Day 11: Romania 2019 presidential votes as five cartogram types. Svelte + D3 dashboard where distortion becomes information. #100DayMapChallenge.
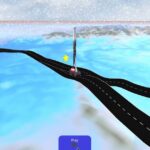
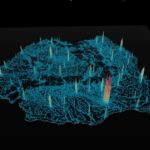
Day 10: Why Hexagons for Population Density – Romania H3
Day 10: Uber H3 at ~400 m for Romania’s population density. Hex columns in the browser via QGIS and Qgis2threejs, without admin borders. #100DayMapChallenge.
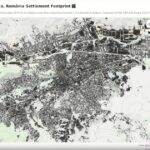
Day 8: Mapping Where People Live from Space – Cluj WSF 2019
Day 8: World Settlement Footprint 2019 at 10 m over Cluj-Napoca. Copernicus Sentinel-1/2, open results, local question on a global layer. #100DayMapChallenge.
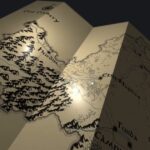
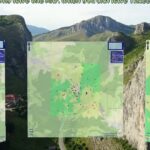
Day 1: The Map That Started Everything – Aiudului Gorges (2011)
The map that started everything: Aiudului Gorges, Romania, 2011. Hand-digitized contours, MapTiler and GDAL2Tiles, rendered in OpenLayers. Day 1 of #100DayMapChallenge.