
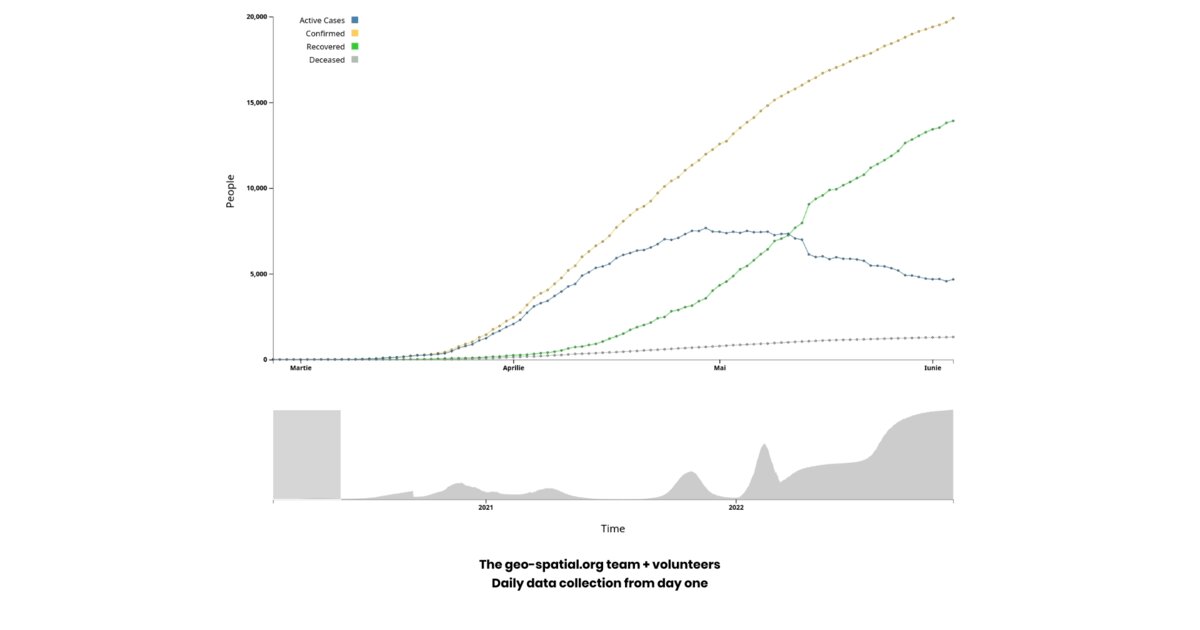
Day 21. February 26, 2020. Romania. Case number one.
On that day, the geo-spatial.org team decided to start monitoring the evolution of COVID cases and the links between them. Together with volunteers, they began collecting data daily from official government reports, enriching it with information from media and other sources. The dataset was made freely available through a public API. Doing this accurately, despite incomplete and delayed official reporting, was a remarkable effort.
I offered to help on the data visualisation side and built an interactive timeline. Three cumulative charts for confirmed, recovered, and lost cases.
Hover for detail. A brush to zoom into any time window. An animation that plays the curve from day one. Later, I added active cases and daily new cases.
The graphic appeared briefly in the media, but its real value was elsewhere. It was part of a broader attempt to make data transparent and accessible at a time when official communication was inconsistent. For me, it was also a way to understand how the virus spread, and to keep my mind occupied during a difficult year.
This is Day 21 of the campaign and the start of a different chapter. Over the next five days, I will share more work from that period. Network graphs. County comparisons. Cluster analysis. When data collection becomes a public service, visualisation becomes part of the same effort.
Live demo: COVID daily cases (EN)
The project
| Piece | Role |
|---|---|
| geo-spatial.org / volunteers | Daily collection + public API |
| Charts | Confirmed, recovered, lost; later active + daily new |
| Interaction | Hover, brush zoom, play from day one |
| Series | Days 21-25: timeline → network → time → geography |
Series note
Days 22-25 continue this dataset: county network, full network, timeline arcs, geographic clusters.
How to follow
- Blog: blog.maptheclouds.com
- LinkedIn: Day 21 post
- Live demo: COVID daily cases (EN)
- Previous: Day 20: Charts Hairball
- Hashtag: #100DayMapChallenge
#100DayMapChallenge · Day 21/100 · LinkedIn
Previous: Day 20: Charts Hairball