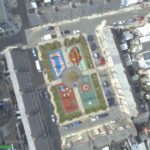
Day 5: NYU Dublin LiDAR, 500M+ points, same PDAL pipeline as Yosemite in an urban context. Geography is local. The tools are global. #100DayMapChallenge.
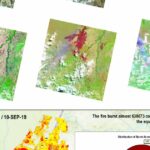
Day 4: Landsat 8 dNBR burn severity near the Bolivia-Paraguay-Brazil border, August 2019. 988,069 acres mapped for recovery planning. #100DayMapChallenge.
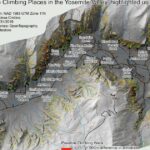
Day 3: PDAL and Entwine on Yosemite Valley LiDAR. 570 million points, JSON pipelines, Potree visualization. Processing took 19 hours. #100DayMapChallenge.
Yosemite Valley climbing walls from 0.5 m airborne LiDAR: slope analysis above 75°, flow direction for wall height, yellow-to-red classification. Day 2 of #100DayMapChallenge.
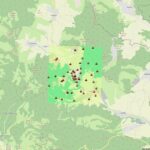
The map that started everything: Aiudului Gorges, Romania, 2011. Hand-digitized contours, MapTiler and GDAL2Tiles, rendered in OpenLayers. Day 1 of #100DayMapChallenge.