Day 4: When maps serve decisions. 🔥
August 2019. Fires near the Bolivia-Paraguay-Brazil border consumed nearly one million acres in a month. Fire managers needed burn severity maps to prioritize recovery efforts, and I used Landsat 8 imagery from before and after the event to produce them.
The differenced Normalized Burn Ratio (dNBR) measures changes in reflectance across near-infrared and shortwave infrared bands. Higher values indicate more severe burn. Workflow: download pre/mid/post-fire scenes, apply top-of-atmosphere reflectance correction, compute NBR for each date, subtract pre from post, classify severity.
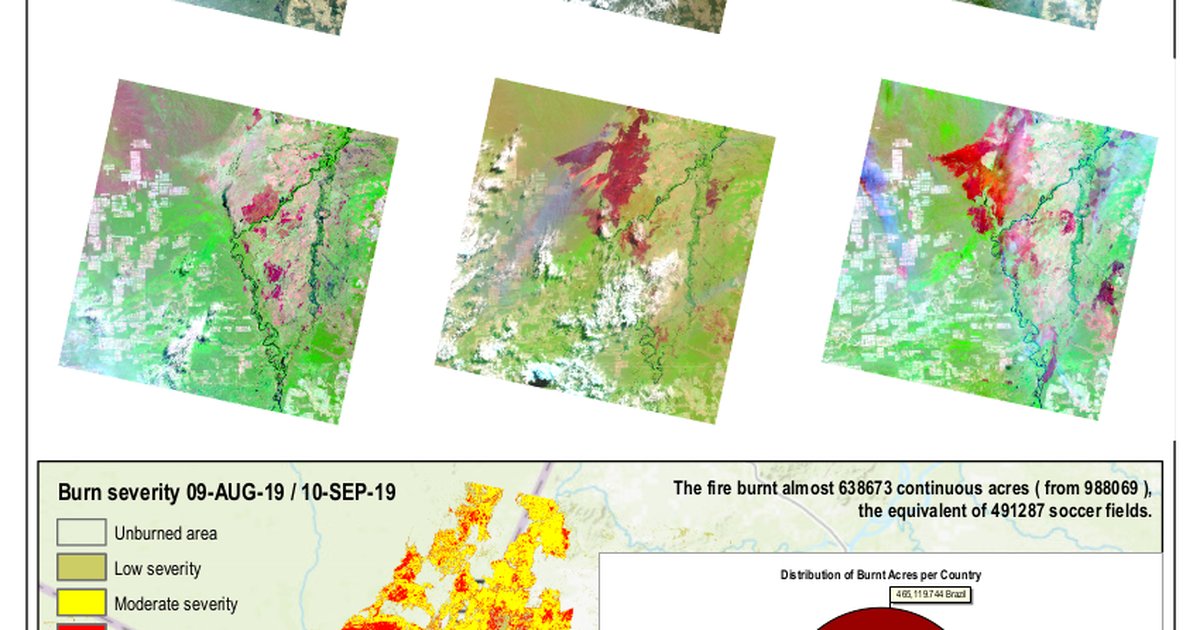
Result: 988,069 acres burned – 284,625 in Bolivia, 238,325 in Paraguay, 465,120 in Brazil. Largest continuous scar: 638,673 acres, roughly 491,000 football fields.
The pipeline combined ArcGIS ModelBuilder with Python automation. Four severity classes: unburned, low, moderate, high. This wasn’t experimental work. It was spatial analysis supporting impact assessment and regeneration planning.
Not every map needs to be beautiful. Some just need to be accurate and fast.
The project
This analysis came from the UC Davis GIS Specialization capstone context: remote sensing applied to a real event, not a synthetic exercise. NASA satellites tracked fires near the Bolivia-Paraguay-Brazil border through August 2019 (outside the Amazon rainforest proper). On August 25, Landsat 8 OLI captured one of the larger burns north of the Paraguay River near Puerto Busch.
The deliverable was decision support: where severity was highest, how much area burned by country, and what continuous scar size meant for regeneration baseline work.
dNBR workflow
| Step | Action |
|---|---|
| 1 | Acquire pre-, mid-, and post-fire Landsat 8 scenes |
| 2 | Top-of-atmosphere reflectance correction |
| 3 | Compute NBR per date (NIR + SWIR, burn-sensitive index) |
| 4 | dNBR = pre-fire NBR minus post-fire NBR |
| 5 | Supervised classification into four severity classes |
| 6 | Zonal stats: acreage by country, largest continuous perimeter |
NBR behaves like NDVI structurally but targets burnt areas. dNBR highlights change between dates, which is what fire managers need for prioritization, not a single post-fire snapshot alone.
Results at a glance
| Metric | Value |
|---|---|
| Total burned | 988,069 acres |
| Bolivia | 284,625 acres |
| Paraguay | 238,325 acres |
| Brazil | 465,120 acres |
| Largest continuous scar | 638,673 acres (~491,000 football fields) |
| Severity classes | Unburned, low, moderate, high |
Tools
- Landsat 8 (OLI): multi-date surface reflectance
- ArcGIS ModelBuilder: repeatable geoprocessing chains
- Python: automation across models and scripts
- Supervised classification: thematic severity signature from dNBR raster
Why this day matters in the series
Days 1-3 moved from web maps to LiDAR terrain to point cloud pipelines. Day 4 is classic operational GIS: index math, change detection, classification, acreage reporting. The map exists so someone can allocate recovery effort, not to impress in a portfolio reel.
How to follow
- Blog: blog.maptheclouds.com
- LinkedIn: Day 4 post
- Previous: Day 3 – PDAL Yosemite
- Hashtag: #100DayMapChallenge
#100DayMapChallenge · Day 4/100 · Fire burn severity · LinkedIn
Previous: Day 3: Nearly 25 Million Points in a Single File
Next: Day 5