
Day 5: Point clouds cross borders. 🌍
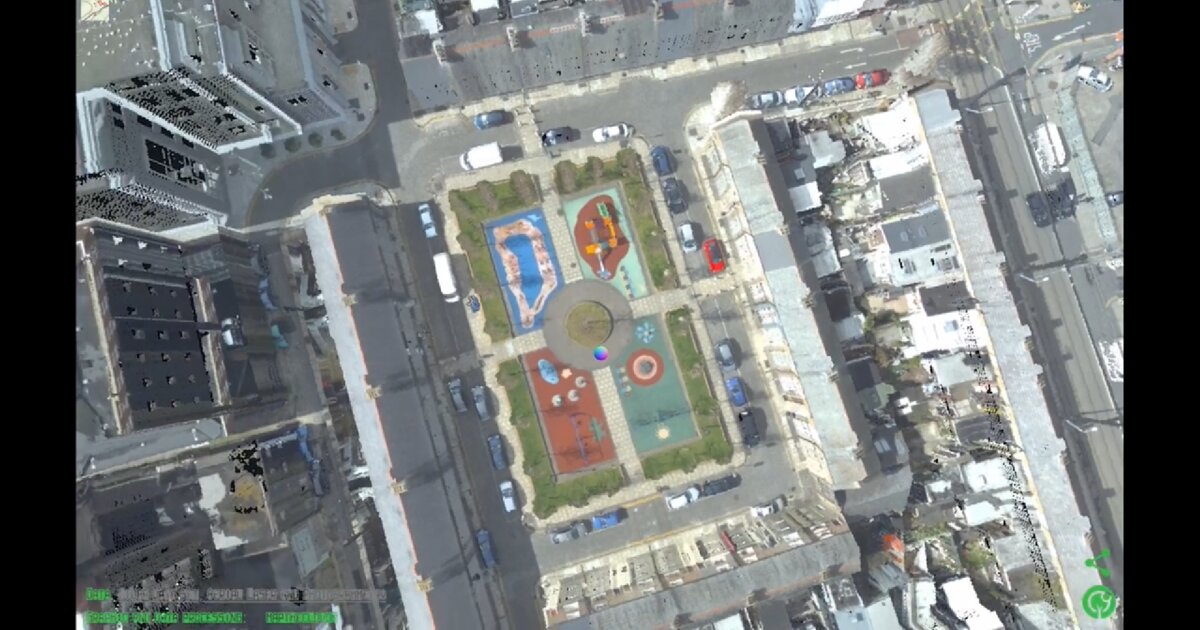
In 2015, NYU captured one of the densest public LiDAR datasets available: Dublin, Ireland at sub-meter resolution. Years later, I downloaded six tiles and processed over 500 million points to explore PDAL workflows and Potree visualization, applying the same pipeline I used for Yosemite in a completely different urban context.
What changes is the environment: dense buildings instead of cliffs, data voids from water and shadows, and more complex classification across roads, rails, and bridges. What stays the same is the pipeline: filter outliers, classify ground, rasterize attributes, and visualize.
This is what fascinates me about open spatial data. A university in New York captures Dublin. Someone in Romania processes it years later. 🇮🇪 A researcher elsewhere can explore it in seconds. Geography is local. The tools are global.
Read more (2020 tutorial): LiDAR PDAL experiments – Dublin
The project
Day 3 and Day 2 stayed in Yosemite: cliffs, DTM, PDAL at mountain scale. Day 5 moves the same tool chain into a dense city.
Data source: NYU Center for Urban Science and Progress, 2015 Aerial Laser and Photogrammetry Survey of Dublin City. Free LAZ tiles plus matching orthophotos. Six tiles, over 500 million points, sub-meter resolution.
The deliverable was not a new algorithm. It was proof that an open pipeline travels: Romania processing Irish geometry captured by a New York lab, viewable in a browser anywhere.
What changes in an urban cloud
| Challenge | Yosemite-style terrain | Dublin urban |
|---|---|---|
| Surface types | Rock, vegetation, sparse structure | Buildings, roads, rails, bridges |
| Data voids | Steep faces, occlusion | Water (Liffey), shadows between blocks |
| Classification | Ground vs non-ground dominant | Multi-class streets and infrastructure |
| Visual read | Relief and wall slope | Roof lines, street canyon, river corridor |
The pipeline order does not change: filter outliers, classify ground, rasterize attributes, colorize, index, visualize. The parameters and failure modes do.
Tools
- PDAL: filter, classify, rasterize, colorize via JSON pipelines
- Entwine: spatial index for large clouds
- Potree: browser streaming after index
- QGIS / bash: checks and batch steps
- Orthophotos (2015 survey): RGB for point colorization
Why this day matters in the series
Days 2-3 proved PDAL on Yosemite. Day 4 was operational fire GIS. Day 5 closes the LiDAR foundation week with a different geography and the same open stack: open capture, open tools, local processing, global reuse.
How to follow
- Blog: blog.maptheclouds.com
- LinkedIn: Day 5 post
- 2020 tutorial: PDAL experiments – Dublin
- Previous: Day 4 – Fire burn severity
- Hashtag: #100DayMapChallenge
#100DayMapChallenge · Day 5/100 · Dublin LiDAR · LinkedIn
Previous: Day 4: When Maps Serve Decisions
Next: Day 6: Antarctica Doesn’t Look Like This (update in WordPress after Day 6 publish)