#30DayMapChallenge Ziua 8. Blue Blue scale 🔷 În acest post, voi vorbi puțin despre stilizarea modelelor de elevație în QGIS, dând exemplu una dintre hărțile pe care le-am făcut pentru #30DayMapChallenge de pe Twitter în 2021. Puteți afla mai multe…
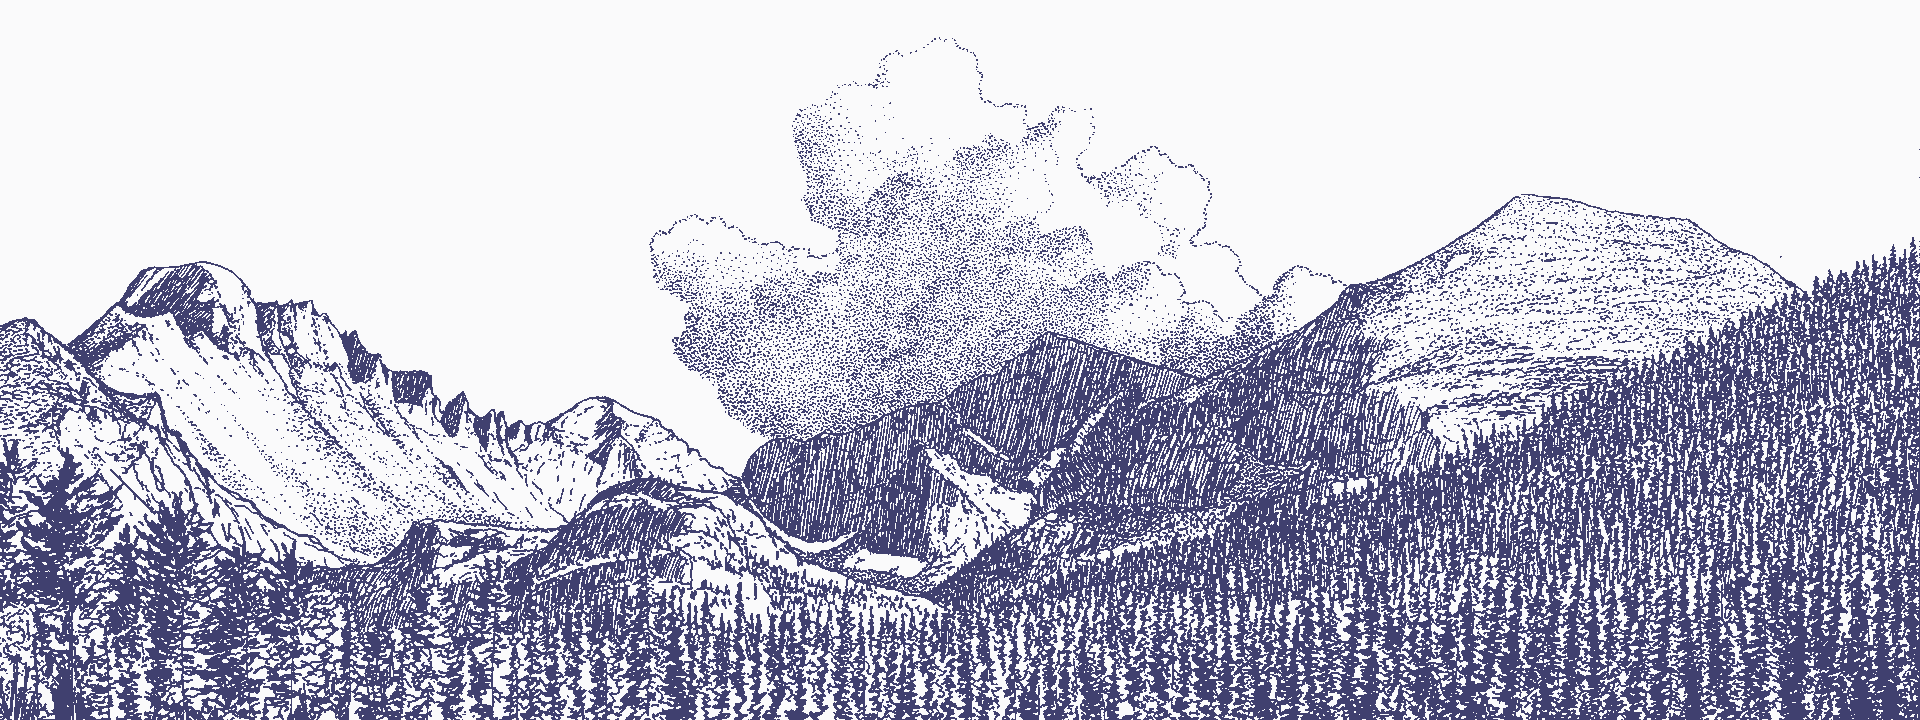
Styling elevation models in QGIS – Blue scale 🔷
#30DayMapChallenge Day 8. Blue Blue scale 🔷 In this post, I’ll talk a bit about styling elevation models in QGIS, giving as an example one of the maps I have made for the #30DayMapChallenge on Twitter in 2021. You can…
Autumn 🍂
#30DayMapChallenge Day 2. Lines Autumn – coloring streams by their flow order in QGIS 🍂 Here’s one of the maps I have made for the #30DayMapChallenge on Twitter in 2021. You can find out more about the challenge and my…
OSM buildings vector tiles in D3.js – City Tiles 🏙️
#30DayMapChallenge Day 3. Polygons City Tiles 🏙️ This is a OSM buildings vector tiles map made using D3.js and Nextzen, that I have prepared for #30DayMapChallenge on Twitter in 2021. You can find out more about the challenge and my…
Harta 3D a Globului în D3.js – Locuri populate pe Pământ 🌍
#30DayMapChallenge Ziua 1. Points Locuri populate pe Pământ 🌍 Harta 3D a Globului în D3.js și Canvas este una dintre hărțile pe care le-am făcut pentru #30DayMapChallenge de pe Twitter în 2021. Puteți afla mai multe despre provocare și despre…
3D globe map in D3.js – Populated Places on Earth 🌍
#30DayMapChallenge Day 1. Points Populated Places on Earth 🌍 This is a 3D globe map in D3.js and Canvas, that I have made for the #30DayMapChallenge on Twitter in 2021. You can find out more about the challenge and my…
#30DayMapChallenge 2021 pentru mine
Iată o poveste despre cum s-a desfășurat #30DayMapChallenge 2021 pentru mine. Am un talent special de a amâna proiectele mele favorite. Iubesc să fac hărți, și în toți acești ani la lucru am digitizat kilometri și kilometri de drumuri, am…
My #30DayMapChallenge 2021
Here’s a story about my #30DayMapChallenge 2021. I have a special talent of delaying my favorite projects. I love making maps, and during all those years at work I have digitized miles and miles of roads, solved thousands of bugs,…
Hexagoane 3D în QGIS – Un tutorial în imagini
Acesta est un tutorial despre derivarea de hexagoane 3D dintr-un model de elevație în QGIS și vizualizarea lor în Threejs cu ajutorul Qgis2threejs. În timp ce se desfășura #30DayMapChallenge 2021 pe Twitter, când pregăteam harta pentru ziua 5, Hexagons, am…
3D hexagons in QGIS – A tutorial in pictures
This is a tutorial about deriving 3D hexagons from an elevation model in QGIS and visualizing them in Threejs using Qgis2threejs. During the #30DayMapChallenge 2021 on Twitter, when I was preparing the map for day 5, Hexagons, I wanted to…