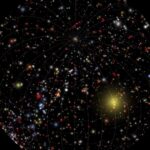
Day 60: Star Map – HYG 3D Catalogue Day 60: 119,614 HYG stars in 3D. Evolution of Day 27. IIB Awards longlist. #100DayMapChallenge. Continue reading “Day 60: Star Map – HYG 3D Catalogue”…
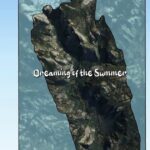
Day 59: Monochrome Moon Day 59: NASA Moon as monochrome depth study. Bloom, displacement, 2D labels. #100DayMapChallenge. Continue reading “Day 59: Monochrome Moon”…
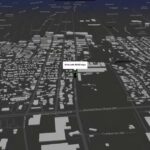
Day 57: Breaking Bad in Albuquerque Day 57: Drive an RV through Breaking Bad Albuquerque. Three.js + Mapbox GL JS. #100DayMapChallenge. Continue reading “Day 57: Breaking Bad in Albuquerque”…
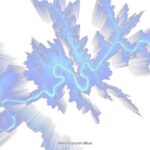
Day 56: Glen Canyon in Blue Day 56: USGS 2m Glen Canyon DEM in blue-turquoise. Same geometry, new perceptual frame. #100DayMapChallenge. Continue reading “Day 56: Glen Canyon in Blue”…
Day 55: Biker Santa – Geospatial Web Game Day 55: Playable 3D web game. Santa on a bike across Romanian DEM terrain. Three.js + QGIS. #100DayMapChallenge. Continue reading “Day 55: Biker Santa – Geospatial Web Game”…
Day 54: Dots – Procedural Globe Halftone Day 54: Earth as a GLSL dot field. ~100k points, ripples, arcs. Three.js. #100DayMapChallenge. Continue reading “Day 54: Dots – Procedural Globe Halftone”…
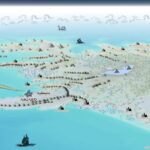
Day 53: AsgardMap – Norse Fantasy Cartography Day 53: AsgardMap client fantasy Mapbox style on Iceland geography. QGIS + Mapbox Studio. #100DayMapChallenge. Continue reading “Day 53: AsgardMap – Norse Fantasy Cartography”…
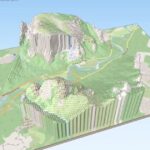
Day 52: The Hexagonal Nose – Yosemite Speculative Geology Day 52: El Capitan as hexagonal columnar jointing. LiDAR base, QGIS to Three.js. #100DayMapChallenge. Continue reading “Day 52: The Hexagonal Nose – Yosemite Speculative Geology”…
Day 50: Yosemite Valley in 3D Day 50: LiDAR Yosemite Valley in 3D. El Capitan, Half Dome, QGIS to Three.js. Mid-campaign milestone. #100DayMapChallenge. Continue reading “Day 50: Yosemite Valley in 3D”…
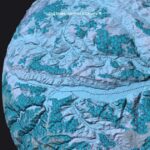
Day 51: Cluj Globe – What if Earth Was a County Day 51: Cluj County OSM wrapped onto a Three.js globe. Scale as perspective shift. #100DayMapChallenge. Continue reading “Day 51: Cluj Globe – What if Earth Was a County”…