
Day 32. Organizational structure as a living network 💼
How do you visualize a 300+ person organization when static hierarchies fail to show how departments actually relate?
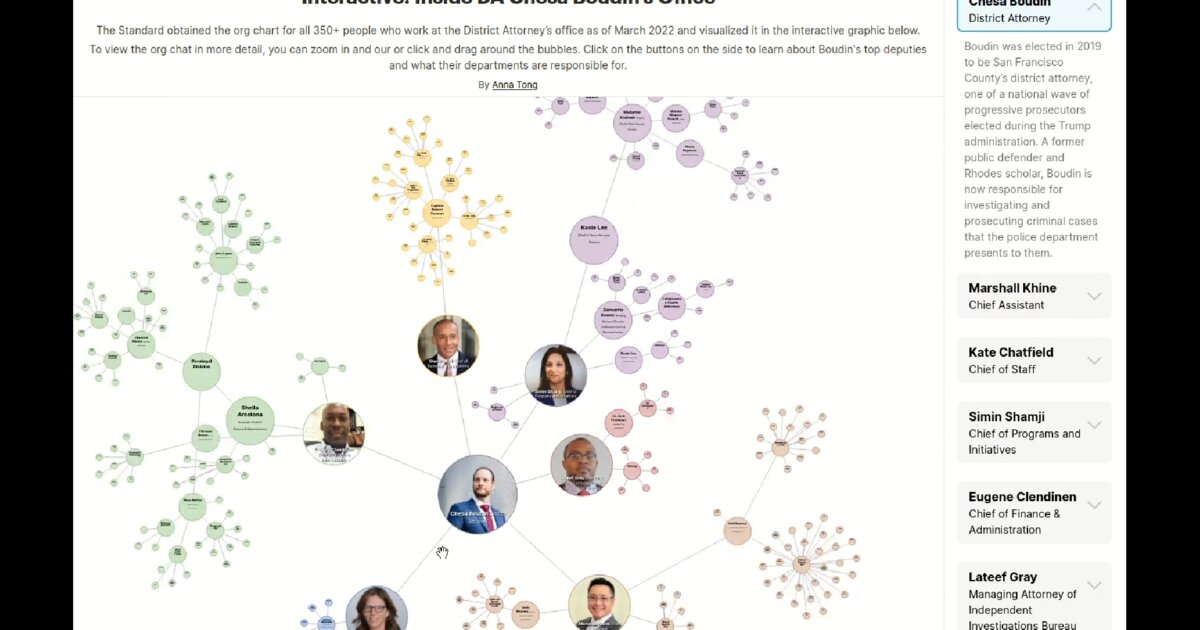
This interactive force-directed chart was built for the San Francisco District Attorney’s Office. It was also my first significant freelancing project, where I worked with Anna Tong on a graphical representation of all 350+ people in the organization.
Each node represents a department, role, or staff member. Instead of a rigid top-down hierarchy, a physics simulation positions nodes based on relationships. Departments expand and collapse on click, and staff photos appear inside circular nodes. The simulation keeps running as users explore the structure, allowing it to adjust and “breathe”.
The main challenge was integrating images and text inside the circular DOM nodes while keeping everything readable. D3.js powers the force simulation and DOM updates, while custom logic handles state transitions and image loading.
The goal was not to reproduce a traditional org chart, but to reflect how organizations actually function. Real institutions behave more like networks than trees. Reporting lines overlap. Collaboration crosses formal boundaries. A static diagram freezes that complexity. A force-directed model can reveal it.
Completed in Q2 2022. The question remains relevant: when structure becomes too complex for conventional diagrams, what do you build instead?
Live demo: SF DA org chart (mapgrnd)
The project
| Piece | Role |
|---|---|
| Client | SF District Attorney office (with Anna Tong) |
| Layout | Force simulation; expand/collapse departments |
| Nodes | Photos + text in circular DOM nodes |
| Stack | D3.js force + custom state / image loading |
How to follow
- Blog: blog.maptheclouds.com
- LinkedIn: Day 32 post
- Live demo: SF DA org chart (mapgrnd)
- Hashtag: #100DayMapChallenge
#100DayMapChallenge · Day 32/100 · LinkedIn
Previous: Day 31: Sakura Bloom