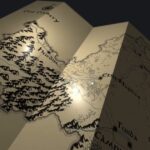
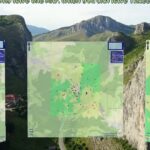
Day 70: Cluj County Folded Map Day 70: Fantasy folded Cluj County map. QGIS to Blender to Three.js. Depth from fold, not DEM. #100DayMapChallenge. Continue reading “Day 70: Cluj County Folded Map”…
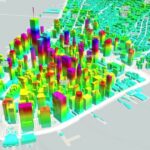
Day 69: Rainbow Cities – Height as Hue Day 69: Building extrusions colored by height. Three.js + MapLibre + GLSL hue mapping. #100DayMapChallenge. Continue reading “Day 69: Rainbow Cities – Height as Hue”…
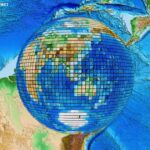
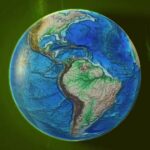
Day 66: Disco Earth – ETOPO1 Mirror Ball Day 66: ETOPO1 as disco mirror-ball Earth. Instanced reflective quads. Inspired by Ksenia Kondrashova. #100DayMapChallenge. Continue reading “Day 66: Disco Earth – ETOPO1 Mirror Ball”…
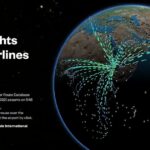
Day 65: OpenFlights World Airlines Day 65: 10,000+ OpenFlights hubs with hover route layers. Instancing + raycasting. #100DayMapChallenge. Continue reading “Day 65: OpenFlights World Airlines”…
Day 64: Aiudului Gorges – Place as Framing Day 64: Aiudului Gorges as CSS3D panels in Three.js. Same Day 1 base map, new framing. #100DayMapChallenge. Continue reading “Day 64: Aiudului Gorges – Place as Framing”…
Day 63: Medley – 2023 Year in Review Day 63: 3-minute 2023 compilation of 3D cartography and WebGL work. Edited in Kdenlive. #100DayMapChallenge. Continue reading “Day 63: Medley – 2023 Year in Review”…
Day 62: Flowers – Women’s Day WebGL Tribute Day 62: Light WebGL flower tribute. Three.js shaders, bloom, motion. Inspired by Akella. #100DayMapChallenge. Continue reading “Day 62: Flowers – Women’s Day WebGL Tribute”…
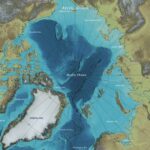
Day 61: Arctic Ocean Bathymetry Day 61: Pole-centred Arctic Ocean bathymetry. IBCAO on Three.js. Orientation as insight. #100DayMapChallenge. Continue reading “Day 61: Arctic Ocean Bathymetry”…
Day 60: Star Map – HYG 3D Catalogue Day 60: 119,614 HYG stars in 3D. Evolution of Day 27. IIB Awards longlist. #100DayMapChallenge. Continue reading “Day 60: Star Map – HYG 3D Catalogue”…
Day 59: Monochrome Moon Day 59: NASA Moon as monochrome depth study. Bloom, displacement, 2D labels. #100DayMapChallenge. Continue reading “Day 59: Monochrome Moon”…