
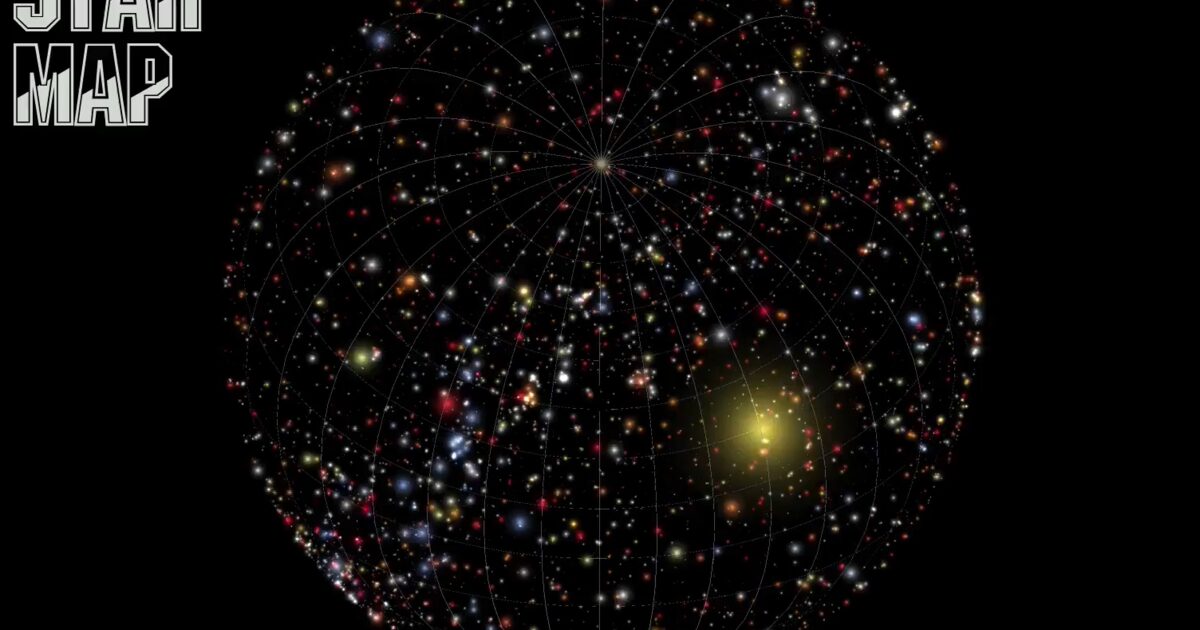
Day 60. Star Map 🌌
When spatial data leaves Earth, cartographic questions do not disappear, they simply expand in scale.
For Day 60, I revisited an enhanced star map built from the HYG database, with 119,614 stars positioned in 3D space using astronomical coordinates. Point size reflects magnitude, colour reflects spectral class, and the scene is designed so navigation feels exploratory rather than overwhelming.
Technically, this version combines Three.js, WebGL, custom point shaders, and a D3.js parsing step to handle the HYG catalogue as a large point cloud while keeping interaction smooth. Right ascension and declination are converted into a globe-friendly latitude and longitude representation, filtered by magnitude, then rendered with additive blending so density reads as light rather than noise.
It builds on Day 27, where the idea began as a simpler prototype. This version carries it further with clearer structure, better pacing, and a level of polish that later reached the Information is Beautiful Awards longlist.
This is still a visualization experiment, not an astronomy analysis tool. But it shows how cartographic thinking extends beyond terrestrial maps.
The map changes scale, but the way we make sense of it does not.
Live demo: Star Map
The project
| Piece | Role |
|---|---|
| Data | HYG catalogue, 119,614 stars |
| Stack | Three.js + WebGL point shaders + D3 parse |
| Encoding | Size = magnitude; colour = spectral class |
| Award | Information is Beautiful Awards 2023 longlist |
| Kin | Evolution of Day 27 prototype |
How to follow
- Blog: blog.maptheclouds.com
- LinkedIn: Day 60 post
- Live demo: Star Map
- Hashtag: #100DayMapChallenge
#100DayMapChallenge · Day 60/100 · LinkedIn
Previous: Day 59: Monochrome Moon
Next: Day 61