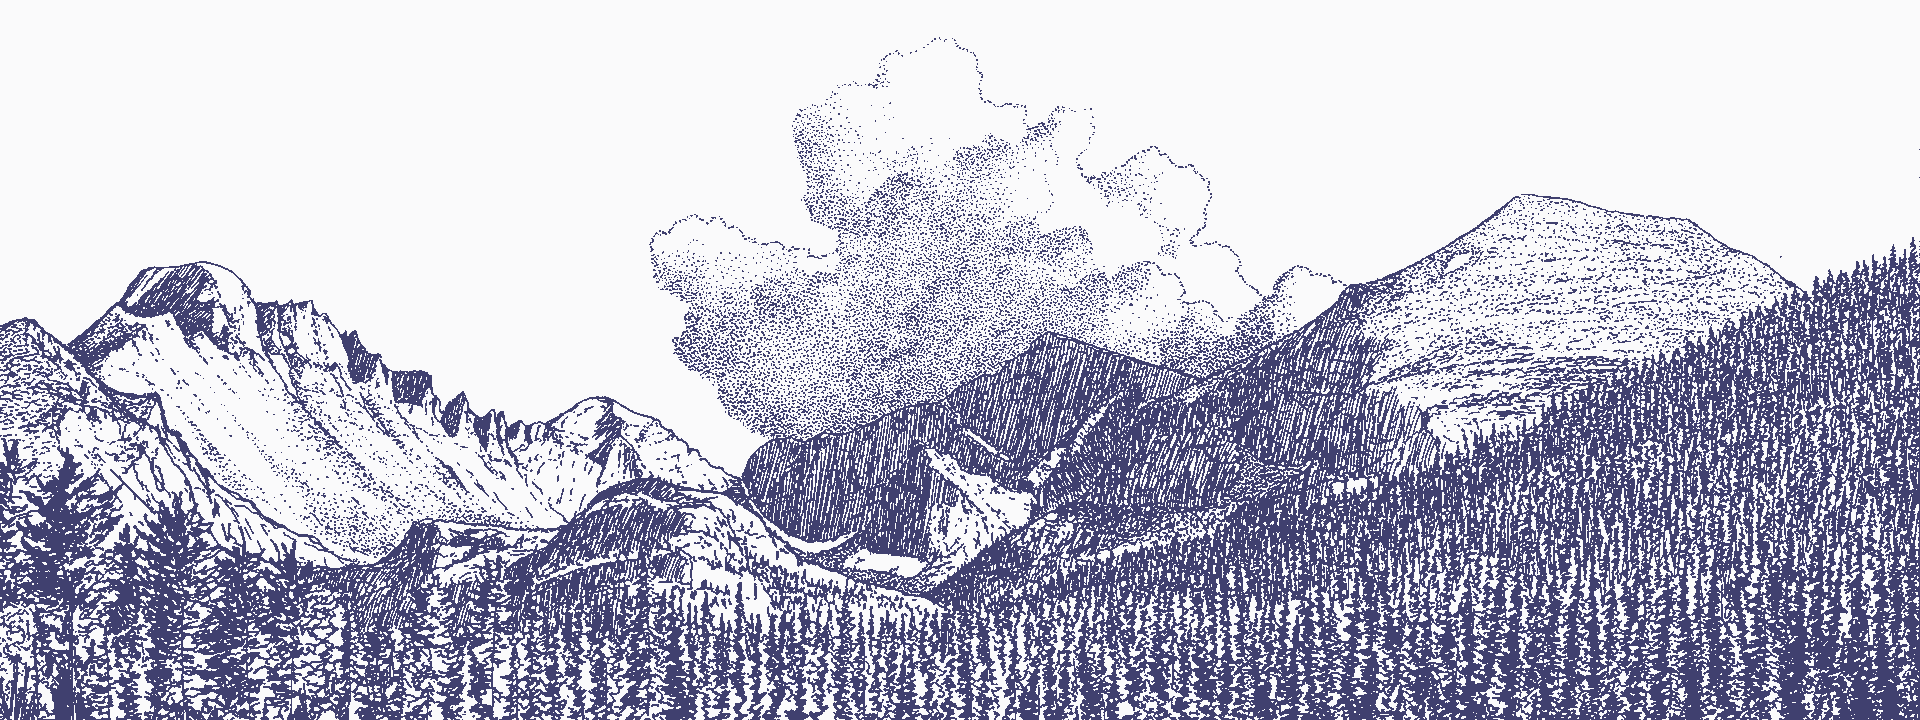
#30DayMapChallenge Day 8. Blue Blue scale 🔷 In this post, I’ll talk a bit about styling elevation models in QGIS, giving as an example one of the maps I have made for the #30DayMapChallenge on Twitter in 2021. You can…
Stilizarea modelelor de elevație în QGIS – Blue scale 🔷
#30DayMapChallenge Ziua 8. Blue Blue scale 🔷 În acest post, voi vorbi puțin despre stilizarea modelelor de elevație în QGIS, dând exemplu una dintre hărțile pe care le-am făcut pentru #30DayMapChallenge de pe Twitter în 2021. Puteți afla mai multe…
Story Maps
🧩 Apps, libraries and examples for building map stories, story maps, storytelling, scrollitelling ? 🧩 You can find a more or less comprehensive list below, started in a thread on Twitter : Esri: https://storymaps.arcgis.com/stories Mapbox: https://mapbox.com/solutions/interactive-storytelling Google Earth Studio: https://google.com/earth/studio/ Cesium Stories: https://cesium.com/blog/2020/01/28/cesium-stories/ Knight Lab…
COVID-19 in Romania – a graph
This post is about the visualizations I’ve made on COVID-19 in Romania, and about data visualization in general.If you are in a hurry, you can go straight to the graphs. Well, 2020 was challenging, and changed many people’s lives. It…