
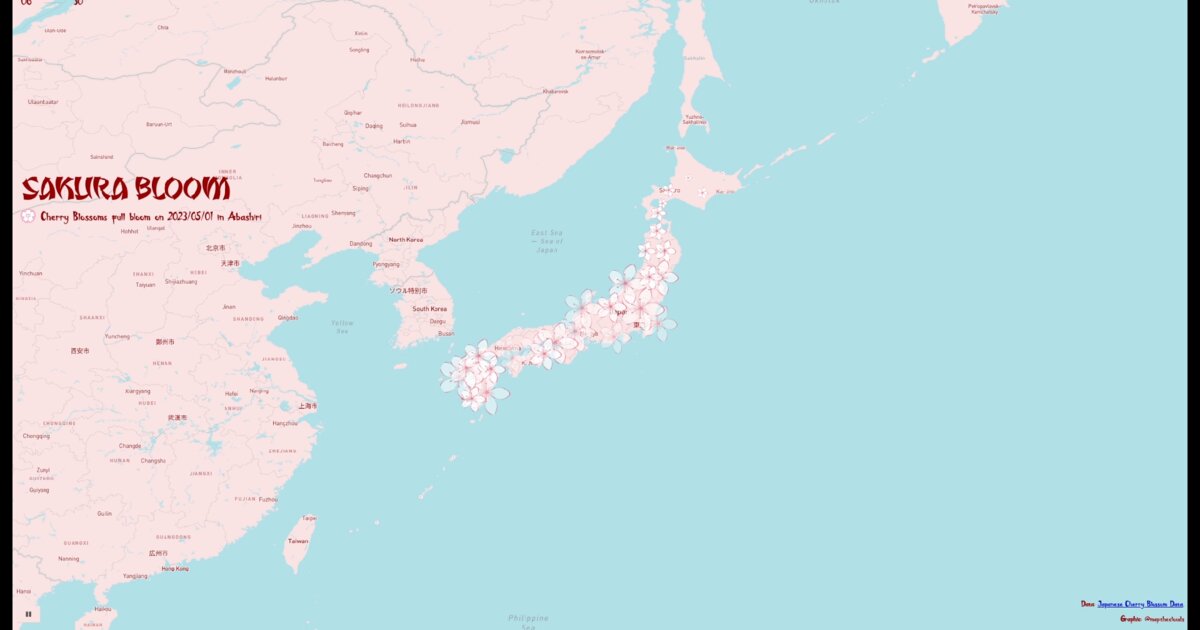
Day 31. Sakura Bloom 🌸
Sometimes a visualization is not about analytical depth, but about timing and movement across space.
This project, Sakura Bloom 💮, maps the progression of cherry blossom season across Japan. The animation shows spring advancing from south to north, shaped by latitude and local climate. It is a pattern people intuitively understand, but rarely see expressed spatially.
The data comes from the Japanese Cherry Blossom dataset on Kaggle. The map is built with Mapbox and OpenStreetMap data, while GSAP controls the animation timeline and easing. The goal was clarity and restraint. Too much detail would distract from the seasonal rhythm. Too many layers would break the flow.
The technical challenge was not complexity, but balance. Smooth motion that feels natural, without overloading the visual field.
Not every project needs to solve a hard problem. Some exist to reveal familiar patterns in a different way.
Live demo: Sakura Bloom
The project
| Piece | Role |
|---|---|
| Data | Japanese Cherry Blossom dataset (Kaggle) |
| Map | Mapbox + OpenStreetMap |
| Motion | GSAP timeline and easing |
| Goal | Restraint: seasonal rhythm over clutter |
How to follow
- Blog: blog.maptheclouds.com
- LinkedIn: Day 31 post
- Live demo: Sakura Bloom
- Hashtag: #100DayMapChallenge
#100DayMapChallenge · Day 31/100 · LinkedIn
Previous: Day 30: Air Distance Germany
Next: Day 32: SF DA Org Chart