
Day 40. Corgi routes 🐶
Some of the most useful projects start as small experimental playgrounds.
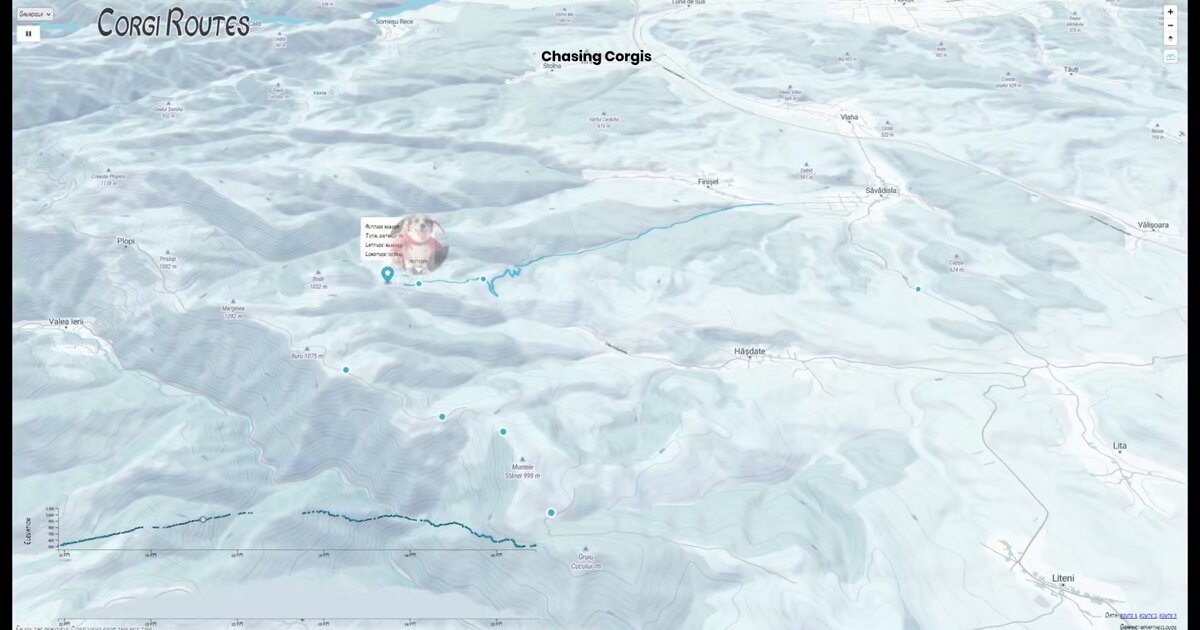
What if GPS routes could be visualized with the same smooth animation and terrain context as apps like Relive? This project explores that idea through an interactive route animator built with MapLibre GL and D3.js.
It’s related to ‘Day 33. Backcountry routes in 3D 🏍️’, but takes a more playful direction: instead of predefined routes, you can upload your own GPX files and explore them directly.
An elevation chart stays synchronized with the animation, showing altitude changes over time. You can play, pause, or scrub through the route, or jump to any point directly from the chart.
The main challenge was handling messy GPX data. Different devices export different formats, with inconsistent elevation and timestamps. The goal was to turn that into smooth, readable animations without manual cleanup.
The result is still experimental, but it shows how flexible route data and modern mapping libraries can come together into a more interactive way of exploring terrain.
Live demo: Corgi Routes
The project
| Piece | Role |
|---|---|
| Stack | MapLibre GL + D3 elevation chart |
| Input | Upload GPX (messy device formats) |
| UX | Play / pause / scrub; jump from chart |
| Kin | Related to Day 33 BDR, more playground |
How to follow
- Blog: blog.maptheclouds.com
- LinkedIn: Day 40 post
- Live demo: Corgi Routes
- Hashtag: #100DayMapChallenge
#100DayMapChallenge · Day 40/100 · LinkedIn
Previous: Day 39: Education Gender Parity
Next: Day 41