
Day 39. When data reveals education inequality at a global scale 🌍
How do you visualize gender disparities across multiple education levels in every country worldwide?
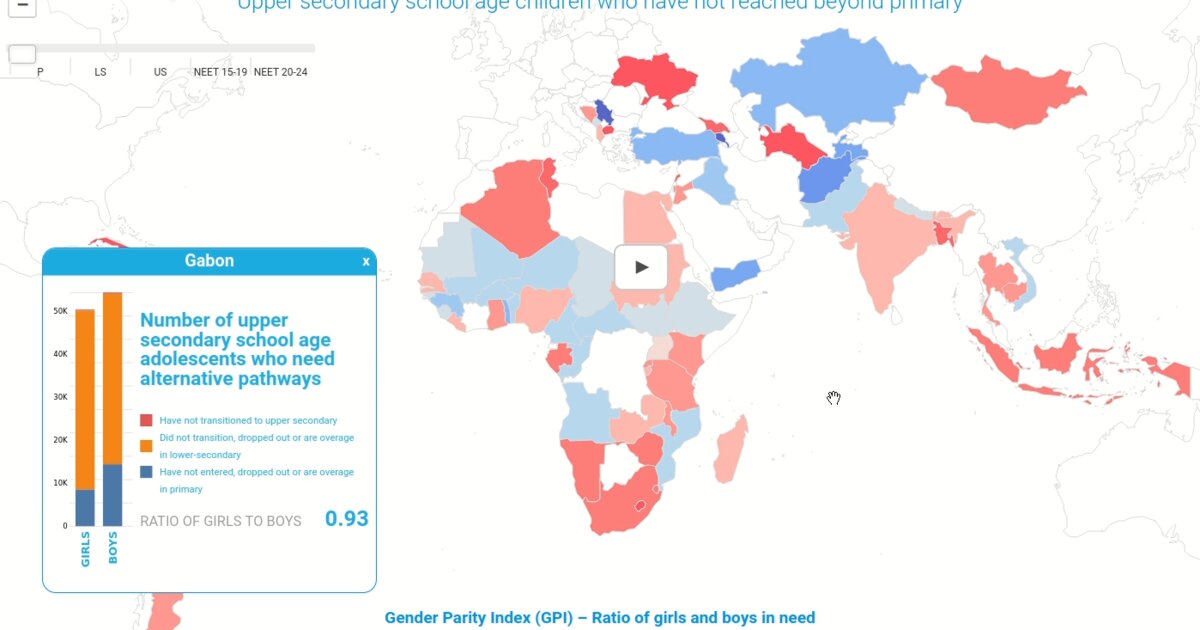
This client project created an interactive animated choropleth map for an international education research organization’s advocacy campaign. The map shows the Gender Parity Index across five education levels, from primary to tertiary education, with both auto-play animation and manual slider controls for exploring changes across the system.
The visualization was built using Leaflet.js for the base map and D3.js for the data layer. Country popups include stacked bar charts displaying absolute numbers by gender and educational status, allowing users to move from global patterns to country-level detail.
One technical challenge was computing a consistent color scale across all five education levels. To ensure comparability, I applied Jenks Natural Breaks to the combined dataset rather than treating each level separately, maintaining both visual coherence and statistical meaning.
The project was developed under tight turnaround constraints. A first working version was ready within the first week for stakeholder presentations, followed by data updates during the process while maintaining the iframe-embeddable WordPress integration. The interface also adapts to different screen sizes through responsive layout detection.
The core message that emerges is simple but powerful: as girls progress through the education system, the gender gap often widens.
Completed in Q1 2022 for an international education research organization and presented at a global education conference as part of an advocacy campaign.
Live demo: not public (client WordPress embed).
The project
| Piece | Role |
|---|---|
| Client | International education research org (confidential) |
| Map | Leaflet base + D3 data layer; auto-play + slider |
| Scale | Jenks Natural Breaks on combined five levels |
| Delivery | Week-1 prototype; WordPress iframe; responsive |
How to follow
- Blog: blog.maptheclouds.com
- LinkedIn: Day 39 post
- Live demo: confidential (client only)
- Hashtag: #100DayMapChallenge
#100DayMapChallenge · Day 39/100 · LinkedIn
Previous: Day 38: Antarctica Gravity
Next: Day 40: Corgi Routes