Day 3: Nearly 25 million points in a single file. Where do you even start?
FOSS4G Bucharest, 2019. Connor Manning and Adam Steer showed what PDAL/Entwine could do with point clouds, and I was hooked. This was the tool I needed.
Point cloud data arrives as millions of unorganized XYZ coordinates. Before slope analysis or terrain rendering, you have to classify ground points, filter noise, build meshes, and interpolate elevation. And the sequence matters.
Filter too early and you lose detail in complex terrain. Filter too late and noise corrupts the analysis.
The tutorial gave me the order. The scale taught me patience.
I documented my PDAL learning journey using Yosemite Valley data: 570 million points across all files, about 19 hours of processing, fully open-source workflows built with JSON pipelines. Every command and output shared for the next person navigating the same terrain.
The visualization loads in seconds. Processing took 19 hours.
Read more (2020 tutorial): LiDAR PDAL experiments – Yosemite Valley
The project
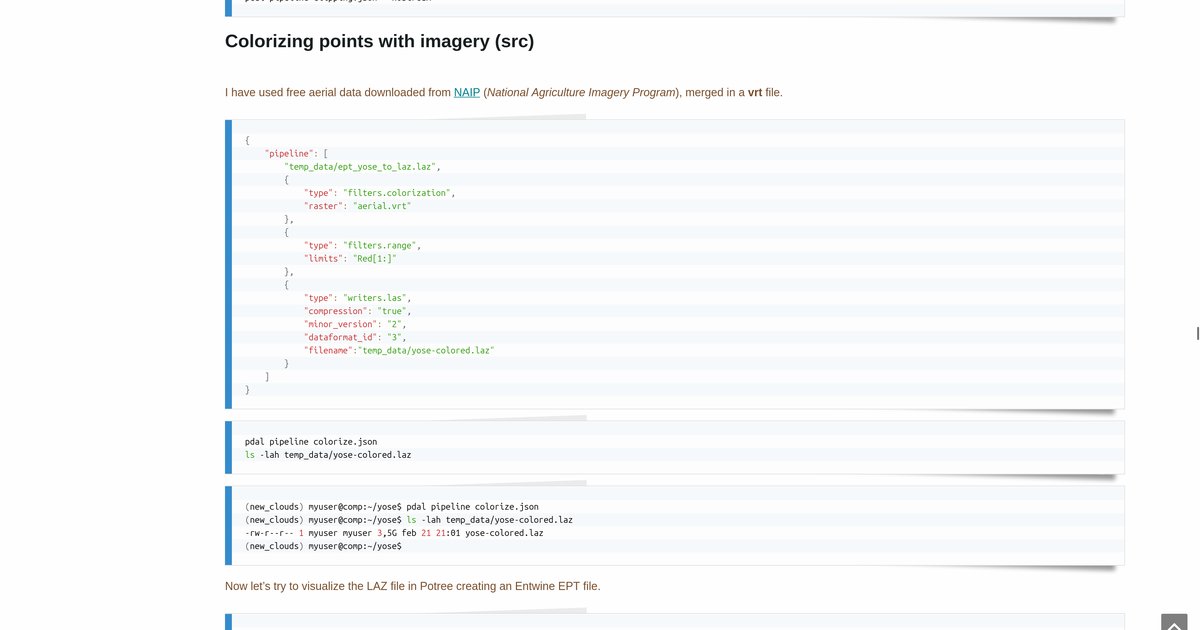
After Day 2’s slope analysis on a DTM, this day steps back to the raw data layer: millions of LAS points from OpenTopography, colorized with NAIP imagery, indexed for web delivery. The question is not only visualization. It is reproducible pipeline order at scale.
Yosemite Valley again, but now as point clouds: three LAS tiles, 570 million points total, one file alone near 25 million.
Pipeline order (why sequence matters)
| Stage | Purpose | Risk if rushed |
|---|---|---|
| Ground classification | Separate terrain from vegetation and structures | Wrong surface for slope or mesh |
| Noise filtering | Remove outliers and acquisition artifacts | False steep faces or holes |
| Mesh / raster steps | Build surfaces for analysis or export | Lost detail or corrupted stats |
| Colorization | Bind aerial imagery to points for readable views | Correct geometry, unreadable output |
| Entwine + Potree | Index for browser streaming | Fast viewer, slow or broken prep |
PDAL expresses this as JSON pipelines: readable, versionable, shareable. That was the FOSS4G lesson: open tools plus documented commands lower the barrier for the next person.
Tools and outputs
- PDAL: filtering, classification, colorization, writers
- Entwine: spatial indexing for large clouds
- Potree: browser visualization (loads in seconds after indexing)
- QGIS / bash: supporting checks and batch steps
The 2020 blog series walks through commands and outputs. The video walkthrough shows the viewer behavior on real Yosemite geometry.
Scale vs speed
Indexing and streaming feel instant in the browser. Preparation does not. 19 hours of processing for the full Yosemite set is the honest counterweight to a Potree view that opens in seconds. That gap is normal in LiDAR work at this scale.
How to follow
- Blog: blog.maptheclouds.com
- LinkedIn: Day 3 post
- 2020 tutorial: PDAL experiments – Yosemite Valley
- Previous: Day 2 – Yosemite climbing walls
- Hashtag: #100DayMapChallenge
#100DayMapChallenge · Day 3/100 · PDAL Yosemite · LinkedIn