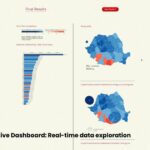
Day 11: When Geography Lies About Votes – Romania 2019 Cartograms Day 11: Romania 2019 presidential votes as five cartogram types. Svelte + D3 dashboard where distortion becomes information. #100DayMapChallenge. Continue reading “Day 11: When Geography Lies About Votes – Romania 2019 Cartograms”…
Elections Data – Spatial Perspectives in QGIS 3.8.3 Last week I wrote about making maps using results from the Presidential Elections that took place on the 10th and the 24th of November in Romania. In this post I will describe how we can process the provided data to… Continue reading “Elections Data – Spatial Perspectives in QGIS 3.8.3”…