Last week I wrote about making maps using results from the Presidential Elections that took place on the 10th and the 24th of November in Romania. In this post I will describe how we can process the provided data to put it on a map.
Usually, data collection and preparation is boring and time-consuming, you have to look for data sources, read metadata, download and clean the data, solve small issues and filter the data to a final form that can be put on a map. I have made this tutorial to help people go straight to the fun part of mapping, the visualization.
If you want to skip this tutorial, the result can be found at https://github.com/alexaac/presidentials2019Data/tree/master/round_2, a shapefile containing election data for the second round, at Romanian administrative units level. Go ahead and make a map with it! 😉
If you are still interested in how was the spatial data matched to the elections data, bear with me and follow the tutorial.
The process
First, create a folder where we will keep the downloaded data and name it prezenta_bec_data (or another name you like).
In order to make a map using data from the elections, we have to associate it to features that have a spatial dimension. That’s why we need both elections data and geography data. We will download the first data set from Biroul Electoral Central, and the second from Geoportalul ANCPI.
Getting the Elections data
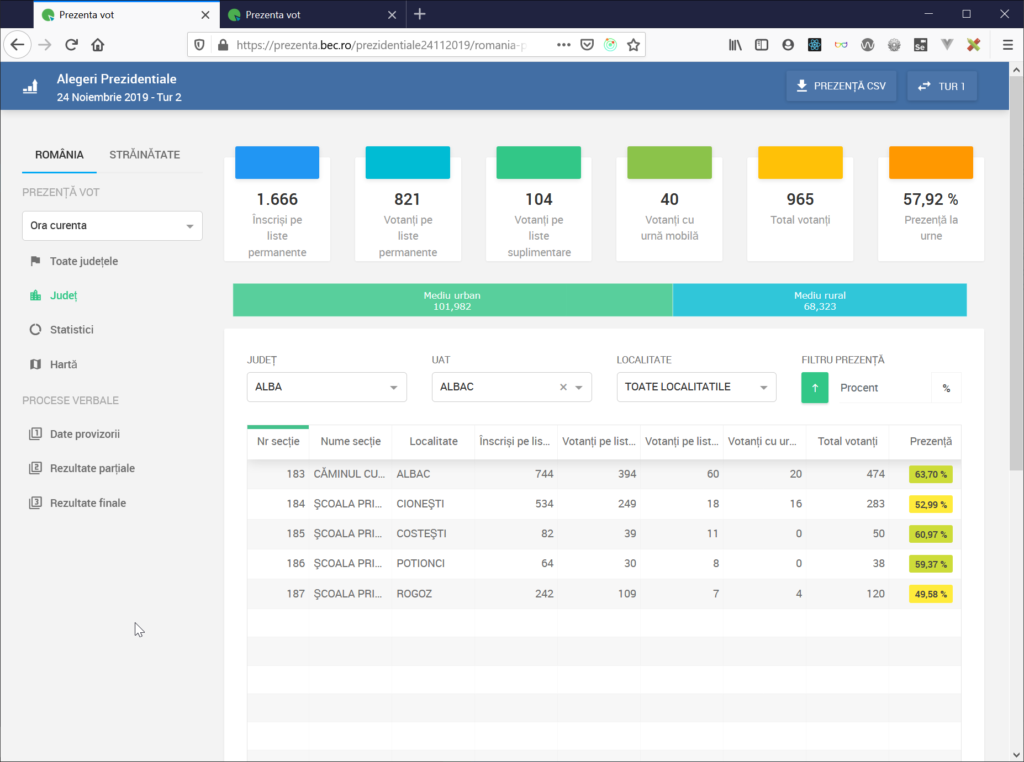
Go to Prezenta BEC. On the main page, you will see results from the second tour of elections, aggregated at county level. In the menu, or on the left of the page, we can see ‘Procese verbale’ and Rezultate finale, from where we can download the results.
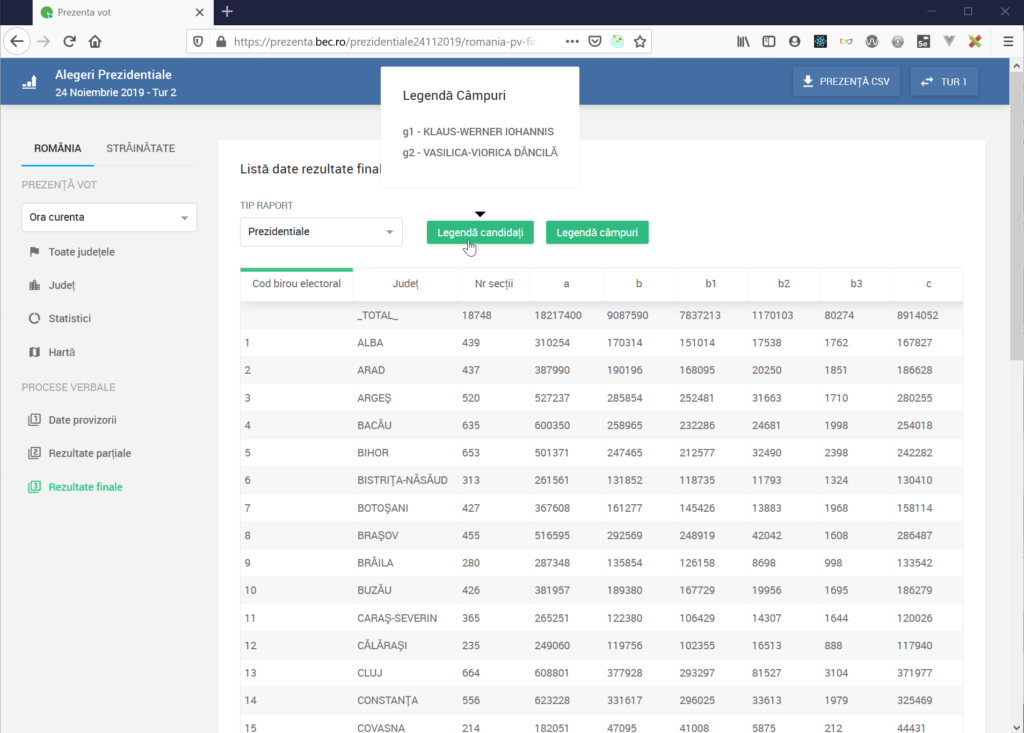
Go to ‘ROMÂNIA’, and click on pv_RO_PRSD_FINAL.csv to download the data for all Romanian election precincts to prezenta_bec_data.

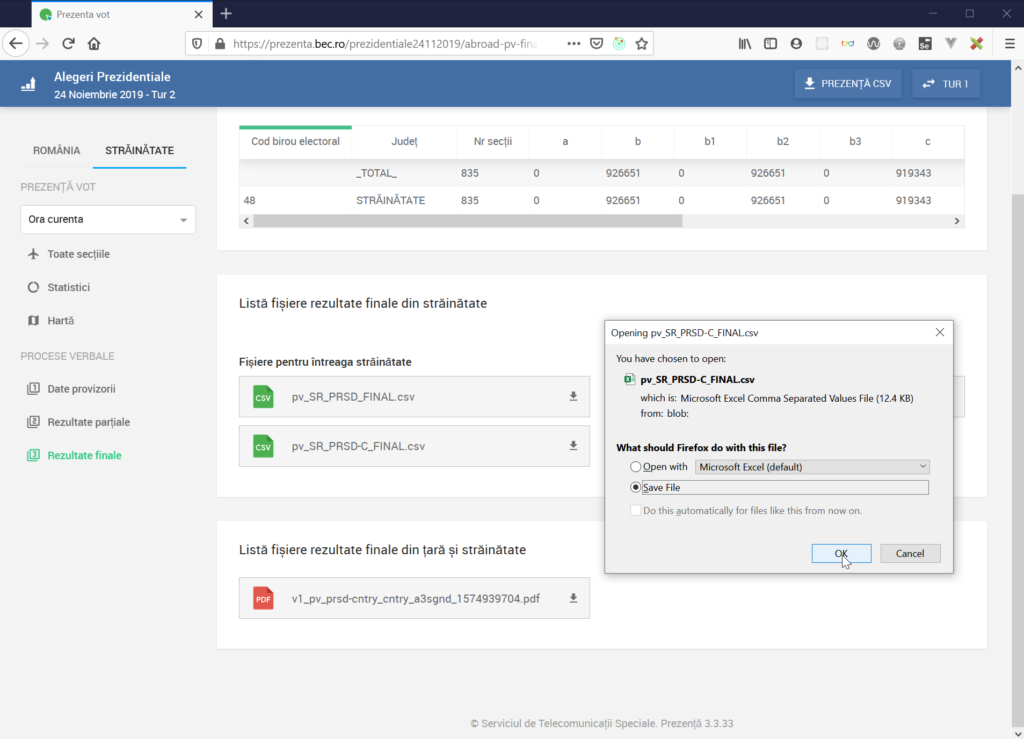
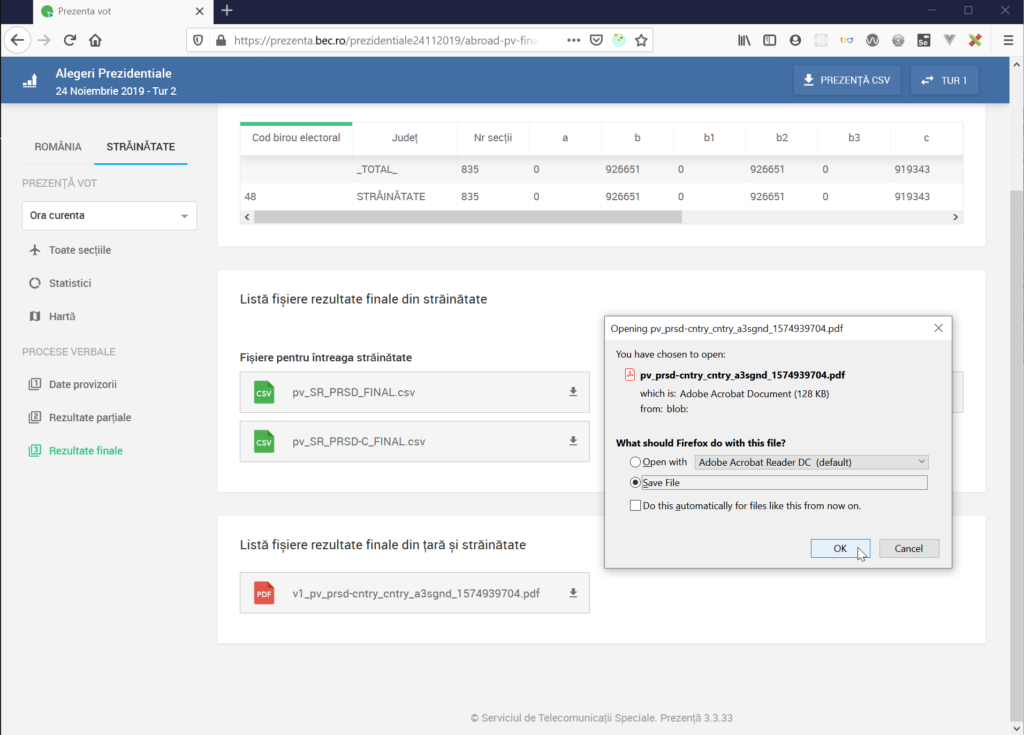
Then, go to ‘STRĂINĂTATE’, and click on pv_SR_PRSD_FINAL.csv and pv_SR_PRSD-C_FINAL.csv to download them. Then click on v1_pv_prsd-cntry_cntry_a3sgnd_1574939704.pdf to download it, we will use the file to check total results per country.

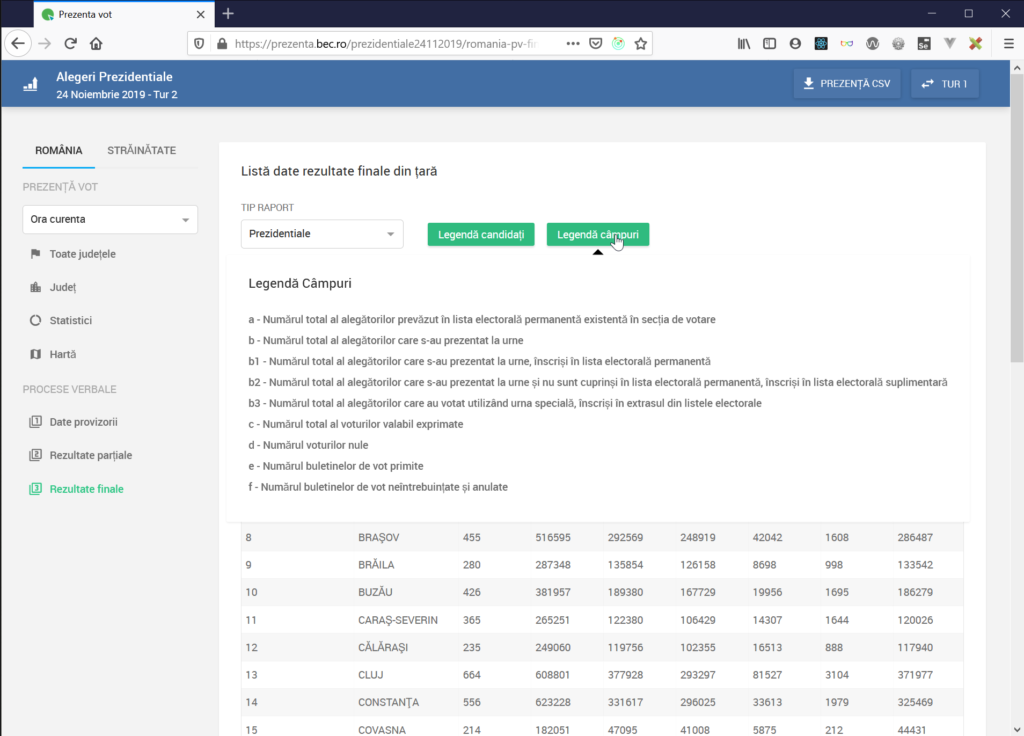
The legend for the candidates names and the names of the columns can be consulted on the same page.
Getting the geographic data
You can go to http://data.gov.ro/, look for ‘unitati administrativ teritoriale’ using Search, and eventually get to http://data.gov.ro/dataset/unitati-administrativ-teritoriale.
Or you can directly access http://geoportal.ancpi.ro/geoportal/catalog/main/home.page, click on the latest link under ‘NEWS | EVENTS’ and get to http://geoportal.ancpi.ro/portal/apps/webappviewer/index.html?id=faeba2d173374445b1f13512bd477bb2.

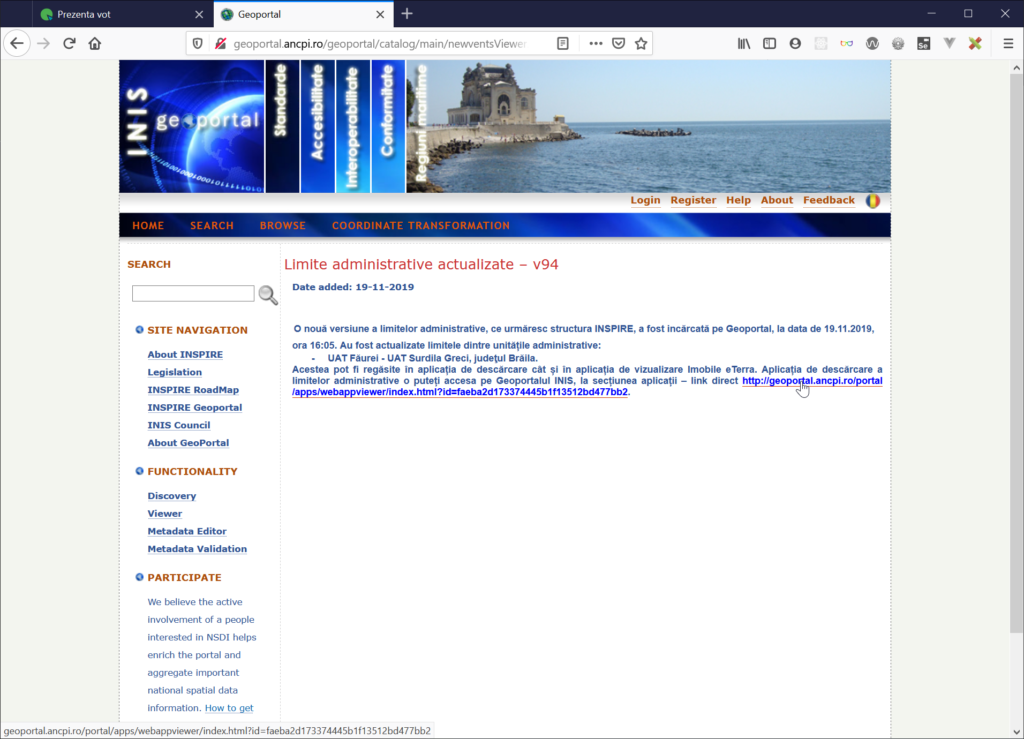
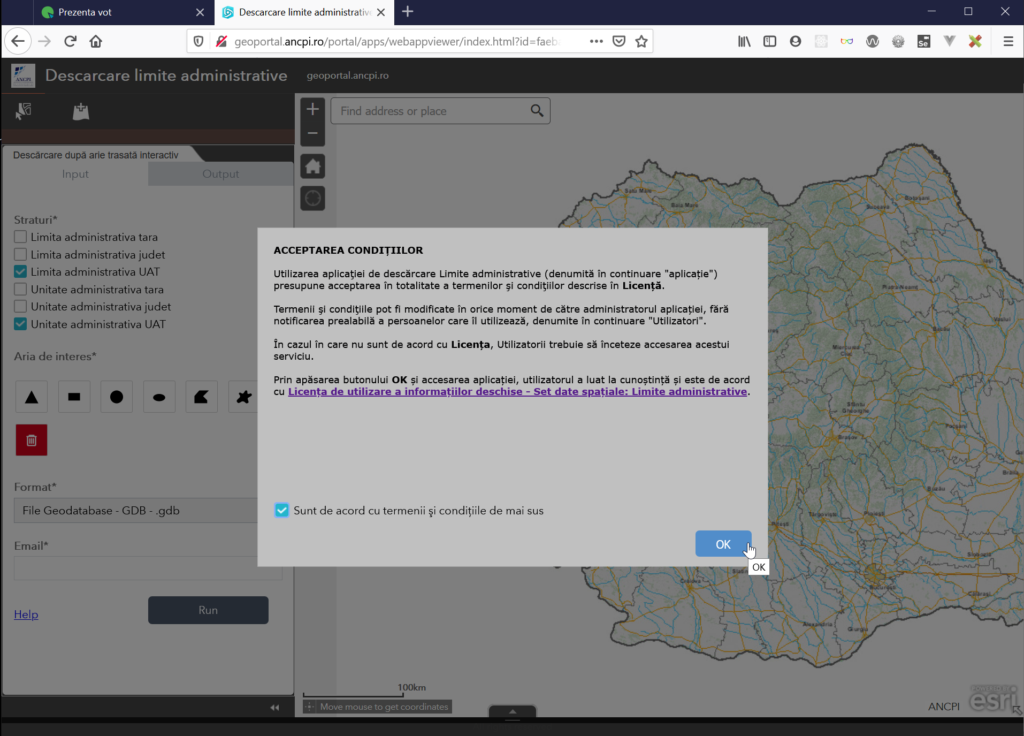
A ‘Terms and conditions’ window will pop up, related mostly to the fact you have to mention the data source and give the right attribution.
The geographic data was created by ANCPI (Agenția Națională de Cadastru și Publicitate Imobiliară), also known as NACLR (the National Agency for Cadastre and Land Registration). The data was published on Geoportalul INSPIRE al României and Portalul de date deschise al Guvernului României under the Open Government License. (More info).
After accepting the terms and conditions, you will be taken to the main web app viewer, where you can navigate the map, select which layers to download, and have the option to draw an area of interest and select the file format.
Depending on the type of map we intend to make, we may want to show specific results at county level, or at a larger scale, at administrative units level. We will download all data, and decide later whish layers to use.
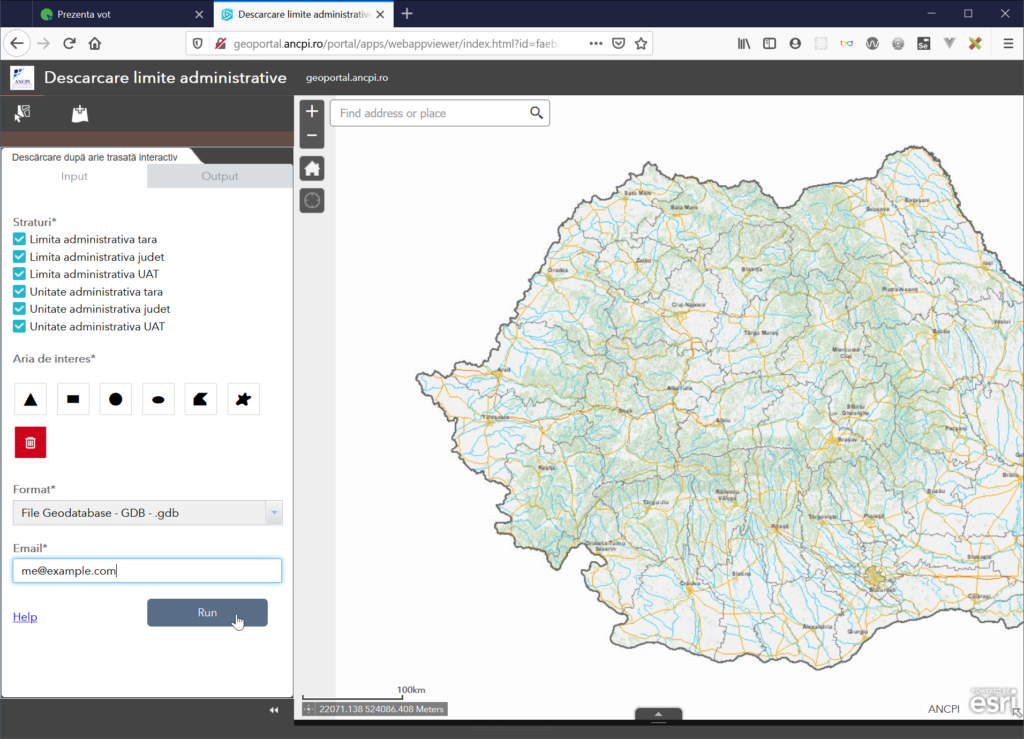
After clicking ‘Run’, you will receive an e-mail containing the data in a compressed zip file. Unzip the file and move the resulting folder to prezenta_bec_data.
Inspecting the data
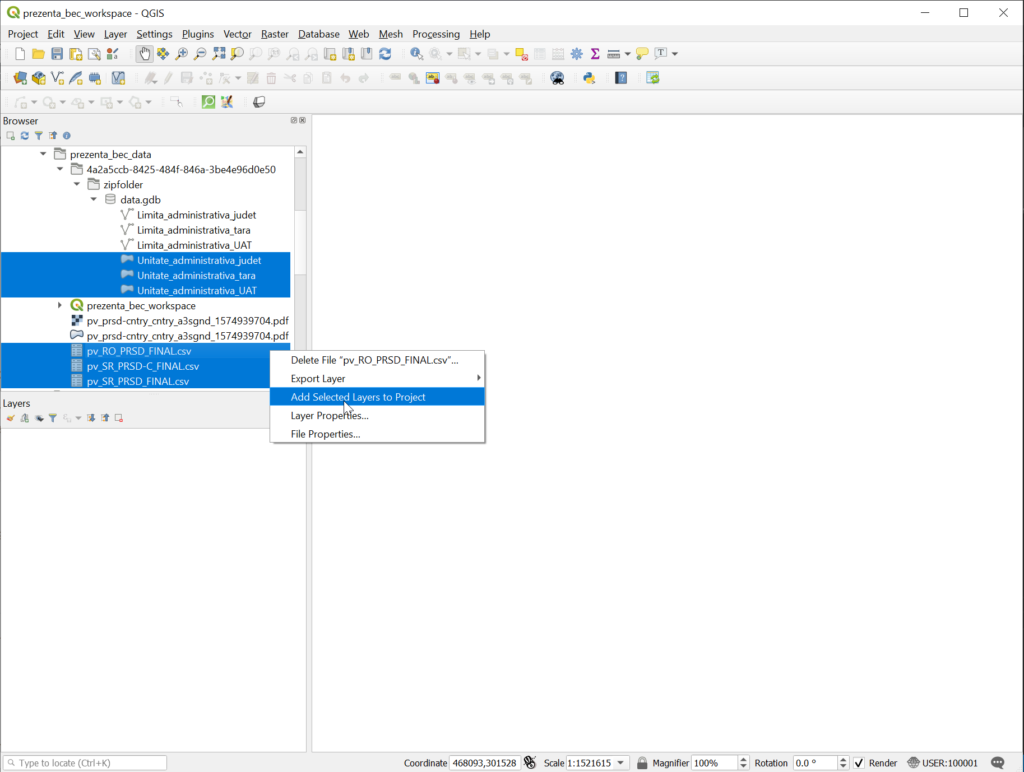
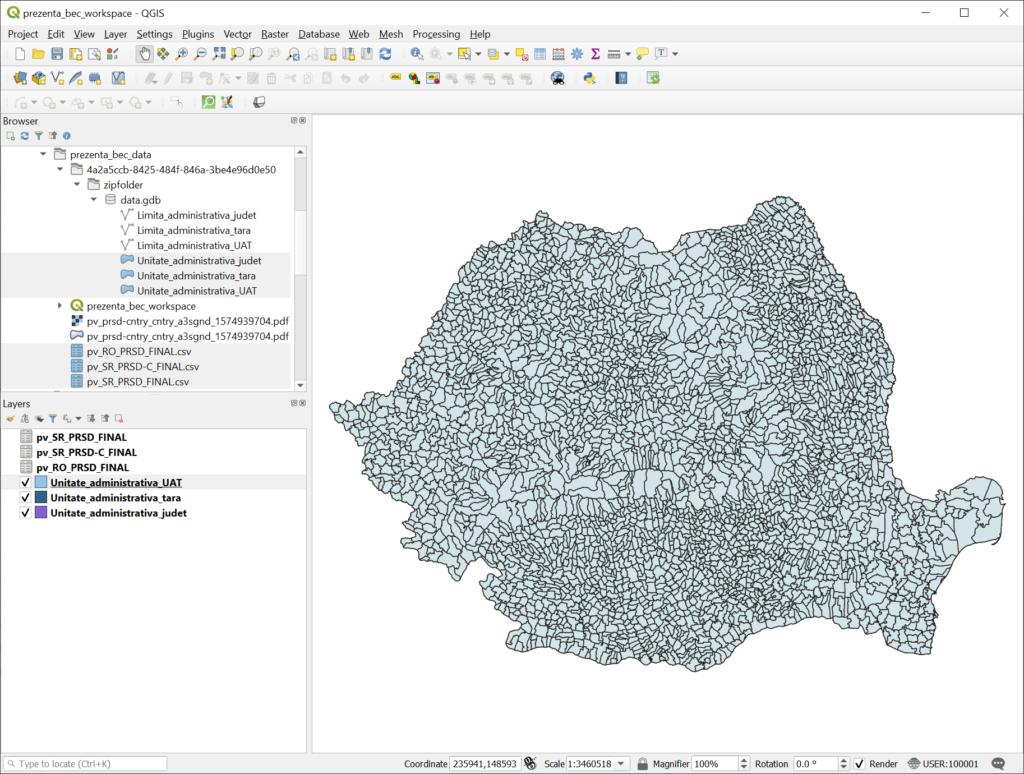
Open QGIS, create a new project and save it as prezenta_bec_workspace. Then navigate to prezenta_bec_data in the QGIS Browser window. You can see now all the downloaded data. I have chosen to download the GIS data as file geodatabase, but you could use shapefile, too.
Let’s look at the data, by adding them to the map. Select the layers containing polygons and the elections data, holding Shift and Ctrl, then Right Click and choose ‘Add Selected Layers To Project’. We can now see the UAT file in the map canvas, and a list of layers in QGIS Layers window.
Take time to inspect the attributes in each layer using Right Click and ‘Open Attribute Table’, and think about which fields we could use to link the two sets of data.
We have added the following data:
- Unitate_administrativa_judet: all counties
- Unitate_administrativa_UAT: all administrative units
- Unitate_administrativa_tara: all country
- pv_RO_PRSD_FINAL: results at precinct level for whole Romania
- pv_SR_PRSD_FINAL: results at precinct level for Abroad voters
- pv_SR_PRSD-C_FINAL : results for Abroad voters, correspondence *
* I still have to confirm the details in this table, I didn’t find metadata for it, yet.
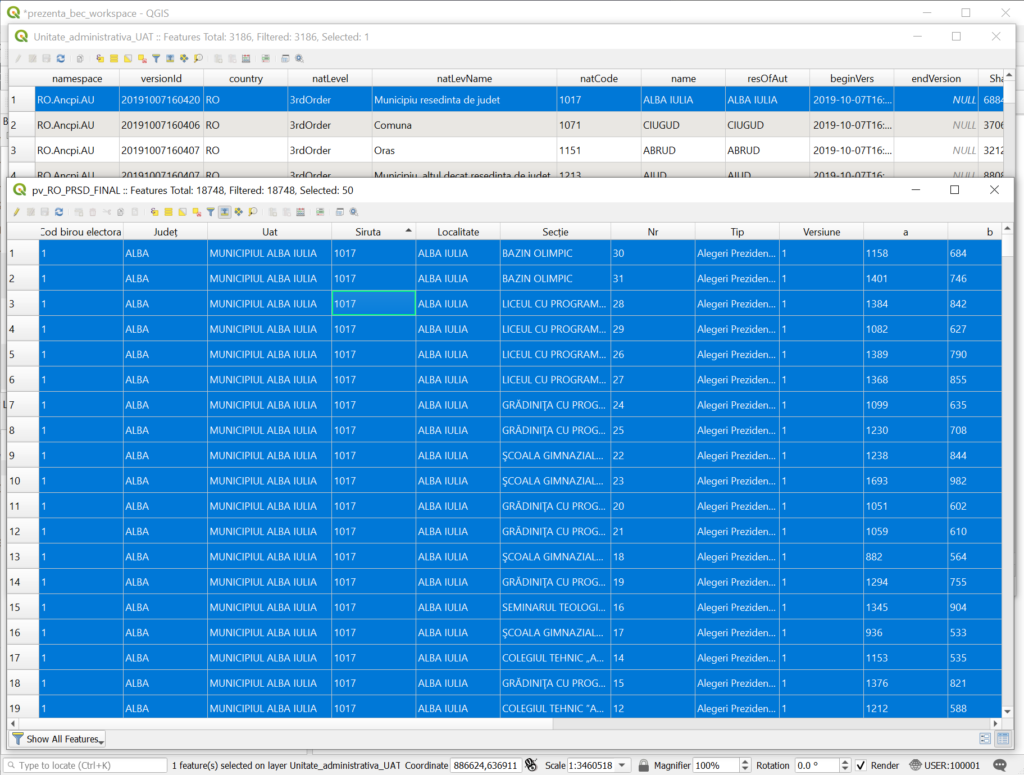
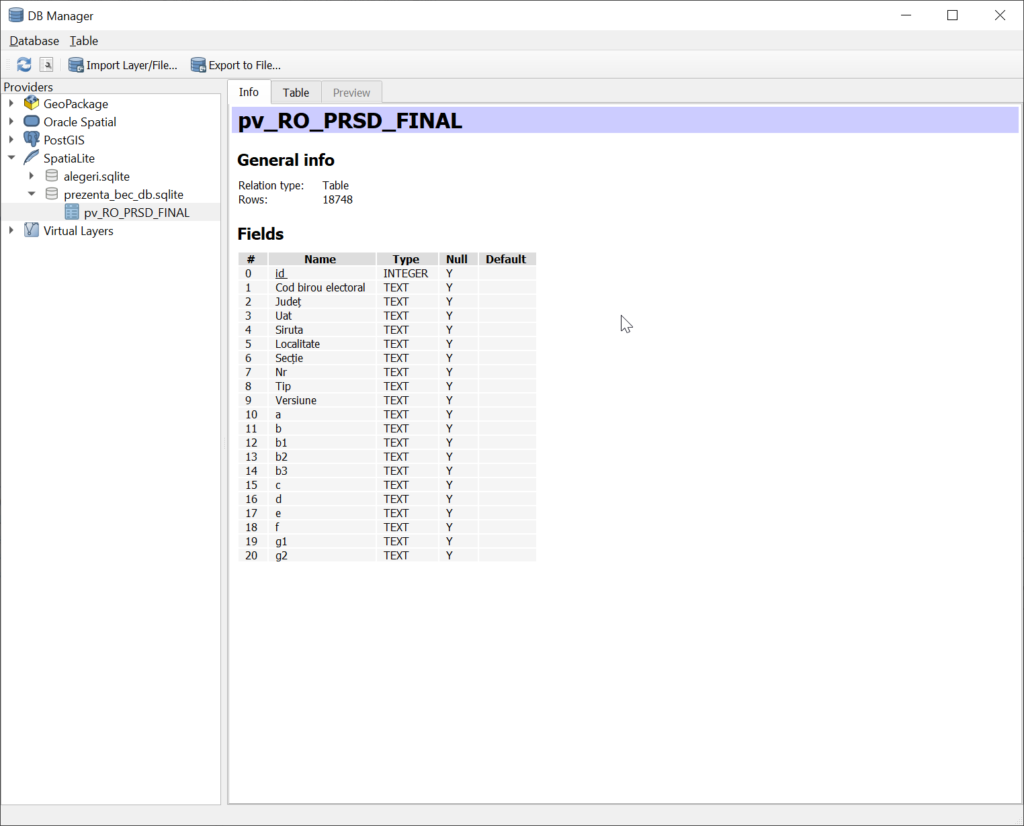
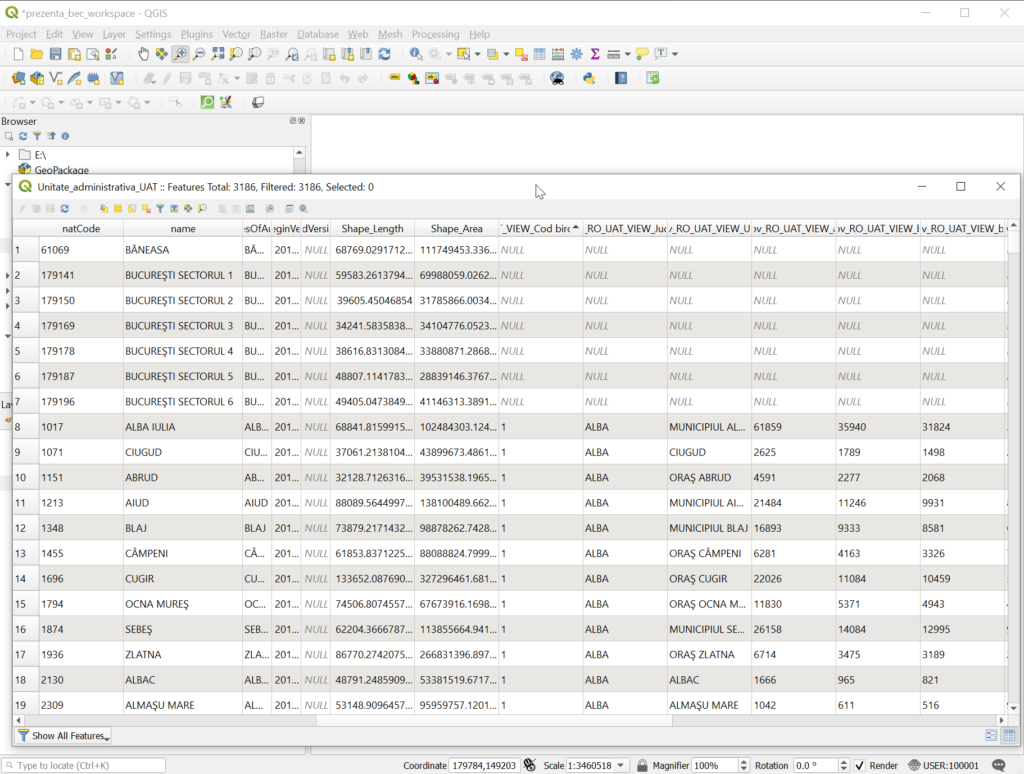
For the moment, we will start to work with Unitate_administrativa_UAT and pv_RO_PRSD_FINAL. The fields that could be of interest for us are ‘natLevel’, ‘natLevName’, ‘natCode‘ and ‘name’ from the geographic data , ‘Cod birou electoral’, ‘Județ’, ‘Uat’ and ‘Siruta‘ from the elections data.
Looking at pv_RO_PRSD_FINAL, we can see it contains the results at precincts level, so if we were to match Unitate_administrativa_UAT with pv_RO_PRSD_FINAL, there would be one record in the first table and multiple records in the second table. For example, per one administrative unit with natCode 1017 (Alba Iulia), we would have 50 precincts with Siruta 1017.
Next, we will group the elections data by administrative units. Are you still on this page, reading the tutorial? If yes, save your workspace (don’t forget to do this from time to time), and let’s continue.
Aggregating the data
We can choose to aggregate the data at administrative units level, or at county level. Let’s start with the administrative units.
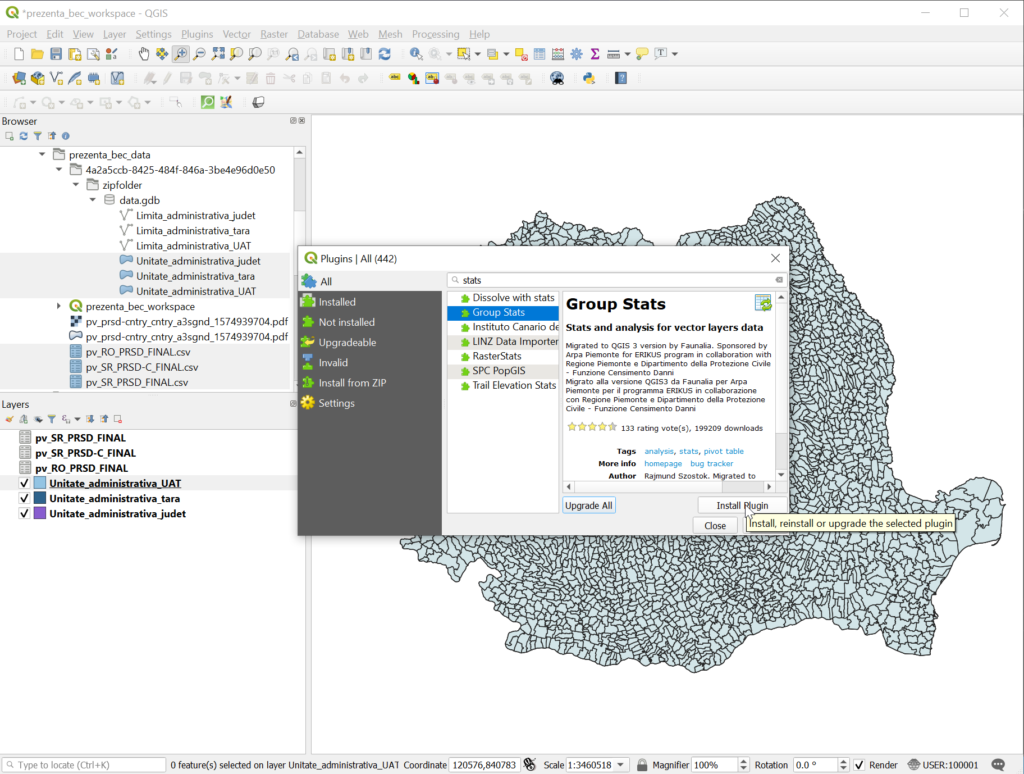
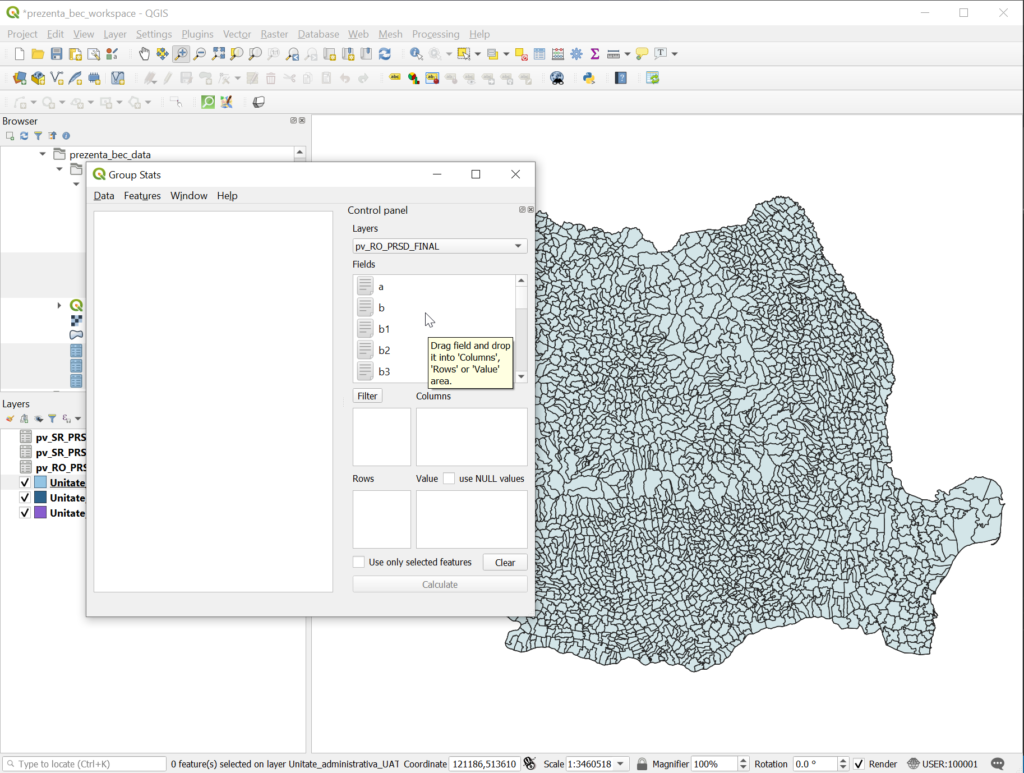
There are multiple ways to aggregate the data in QGIS, one of them is the Group Stats plugin, that can be easily installed using Plugins -> Manage and Install Plugin, but it can summarize only numeric fields (Group Stats Tutorial). The fields from pv_RO_PRSD_FINAL are of String type, so I would have to create new numeric fields and populate them from the original fields.
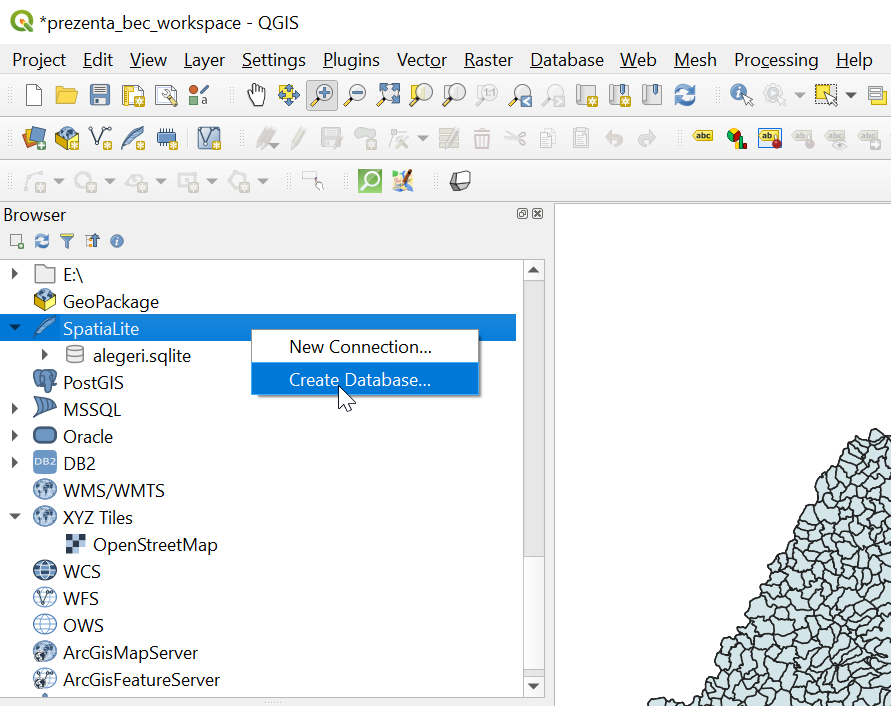
I also want to query the data, so instead I choose to use SpatiaLite, a Database Management System (DBMS). If you are ok with this option, go to QGIS Browser window, scroll to the bottom, Right Click on SpatiaLite to ‘Create Database’, and name the new database prezenta_bec_db.
Then go to the menu bar on the top of QGIS window and Click on Database -> DB Manager.
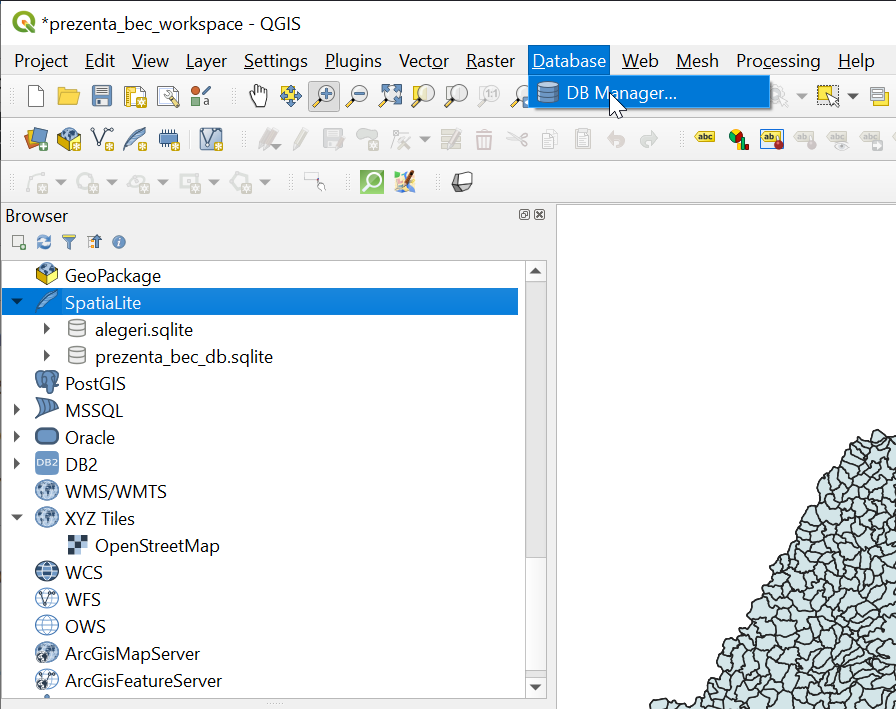
This command would open a new DB Manager window. In the ‘Providers’ section, under SpatialLite, you should see the newly created database, prezenta_bec_db. Double-click on it and start a new connection.
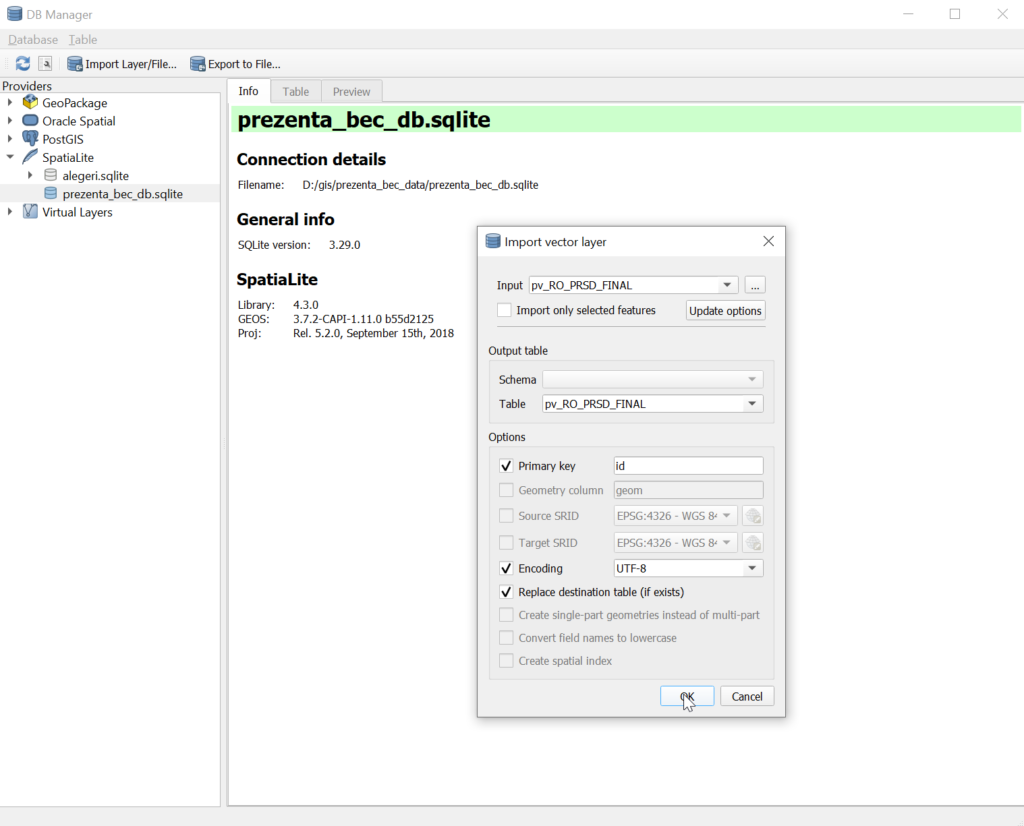
Use Import Layer/File to import pv_RO_PRSD_FINAL, and check primary key as id, UTF8 and overwrite existing file. We use a primary key because it can quickly associate data from multiple tables, and it will help us with Joins.
Now we can see pv_RO_PRSD_FINAL under prezenta_bec_db.sqlite, and inspect the file and the data using Info and Table tabs.
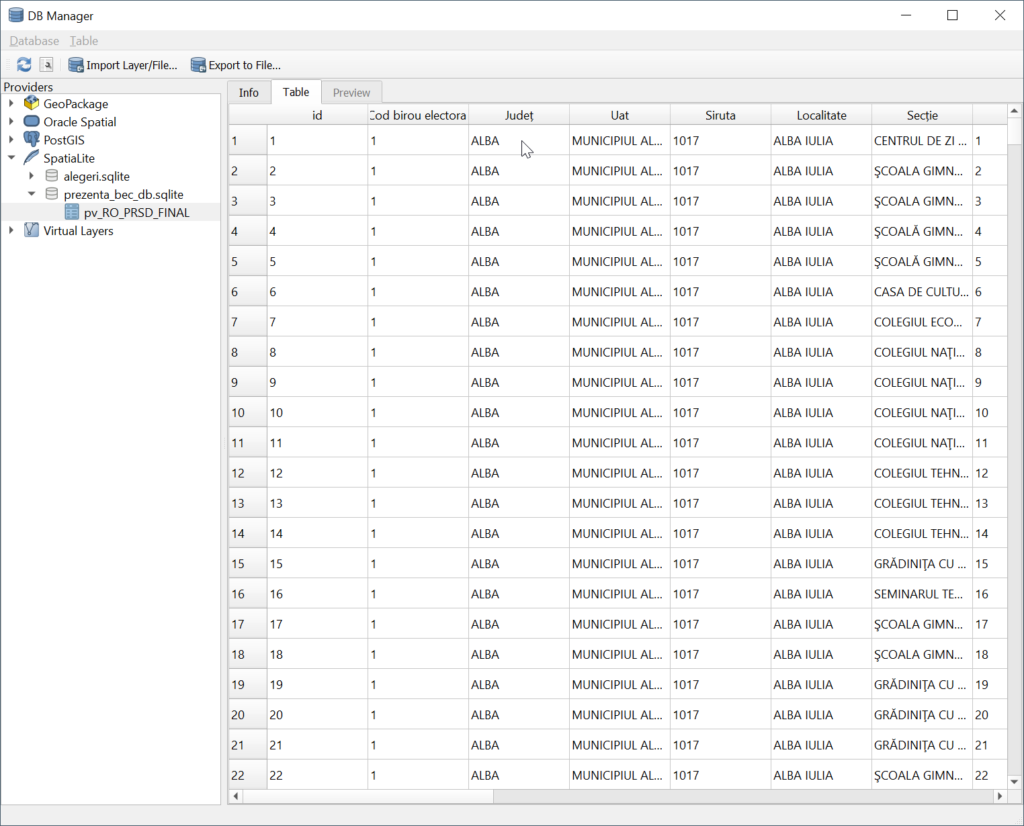
Open a new SQL Window, here we will query and aggregate our data:
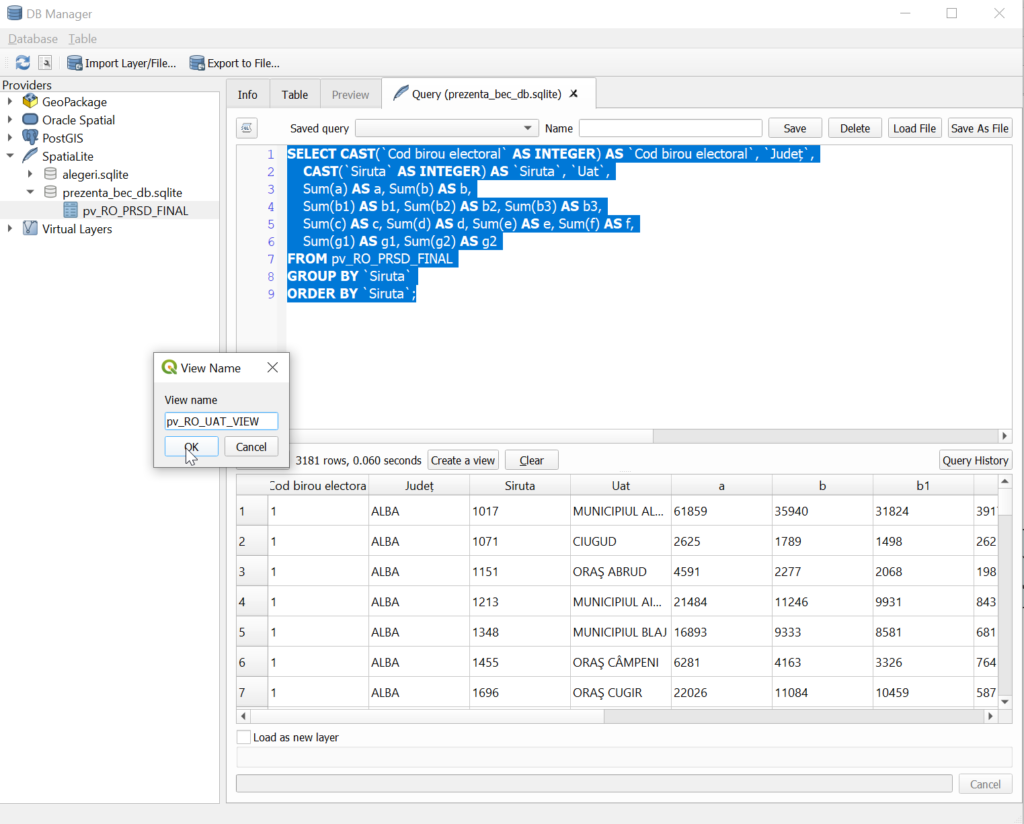
SELECT CAST(`Cod birou electoral` AS INTEGER) AS `Cod birou electoral`, `Județ`,
	CAST(`Siruta` AS INTEGER) AS `Siruta`, `Uat`,
	Sum(a) AS a, Sum(b) AS b,
	Sum(b1) AS b1, Sum(b2) AS b2, Sum(b3) AS b3,
	Sum(c) AS c, Sum(d) AS d, Sum(e) AS e, Sum(f) AS f,
	Sum(g1) AS g1, Sum(g2) AS g2
FROM pv_RO_PRSD_FINAL
GROUP BY `Siruta`
ORDER BY `Siruta`;
We use CAST AS INTEGER to return numeric values from text values. Backticks are used to isolate field names that contain spaces or strange characters.
We execute this statement, then Click on ‘Create a view’ button to save the query results as a temporary layer linked to the original data, pv_RO_UAT_VIEW. Click Refresh, and you will see the new table below pv_RO_PRSD_FINAL.
Now we have a new table, with aggregated elections data, that we can join back to the geographic data in QGIS.
Click ‘Save as file’ in the Query window to save the queries file for later use, into a file named prezenta_bec.sql.
In order to add the table as layer in QGIS , we can Right Click and ‘Add to canvas’ in the DB Manager window, or ‘Add Layer to Project’ in the QGIS Browser window.
Join by Attributes
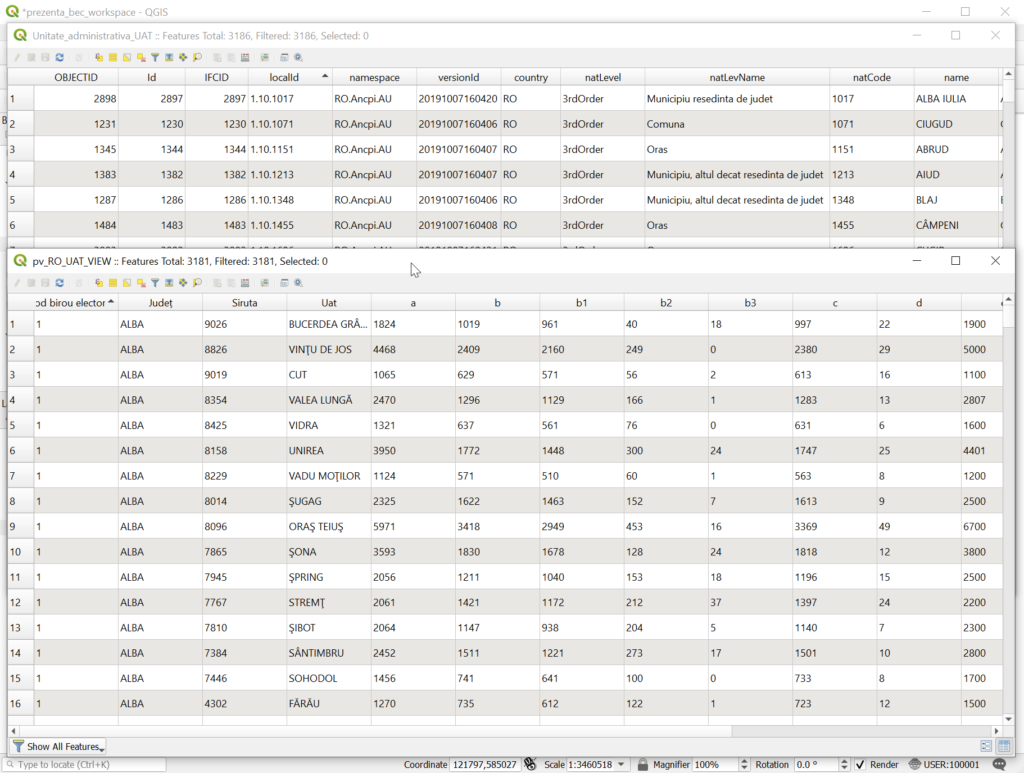
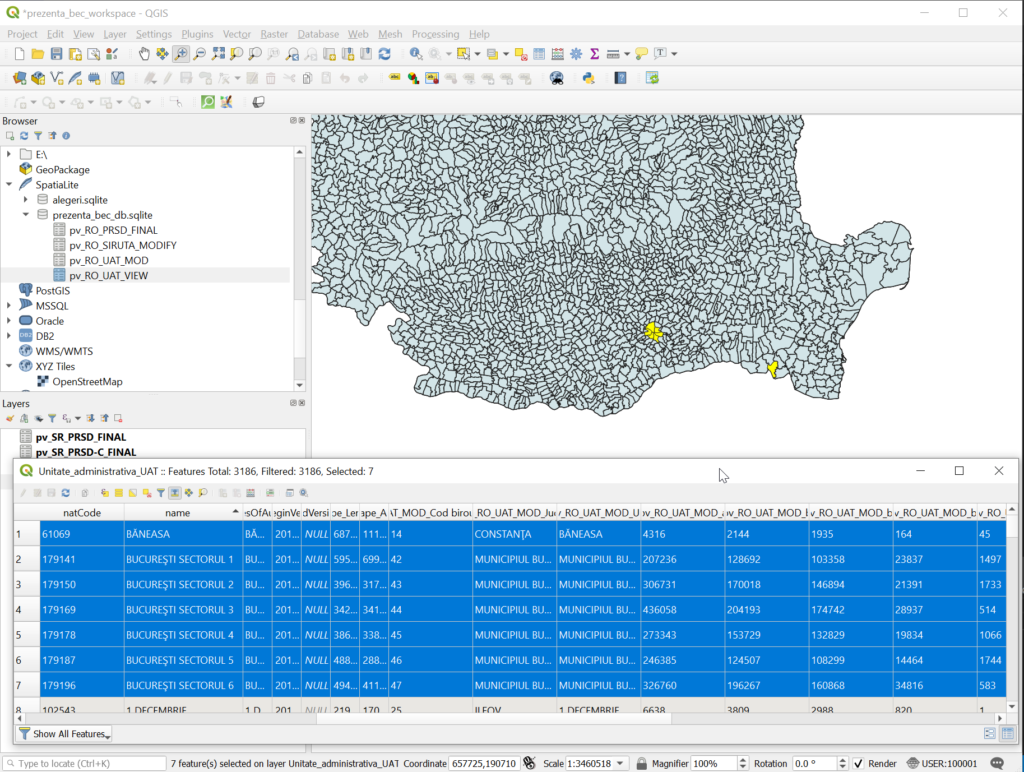
Back in the QGIS main window, open Unitate_administrativa_UAT and pv_RO_UAT_VIEW tables. We can see there are 3186 records in the first table, and only 3181 in the second, so there are places that don’t have elections data after the Join.
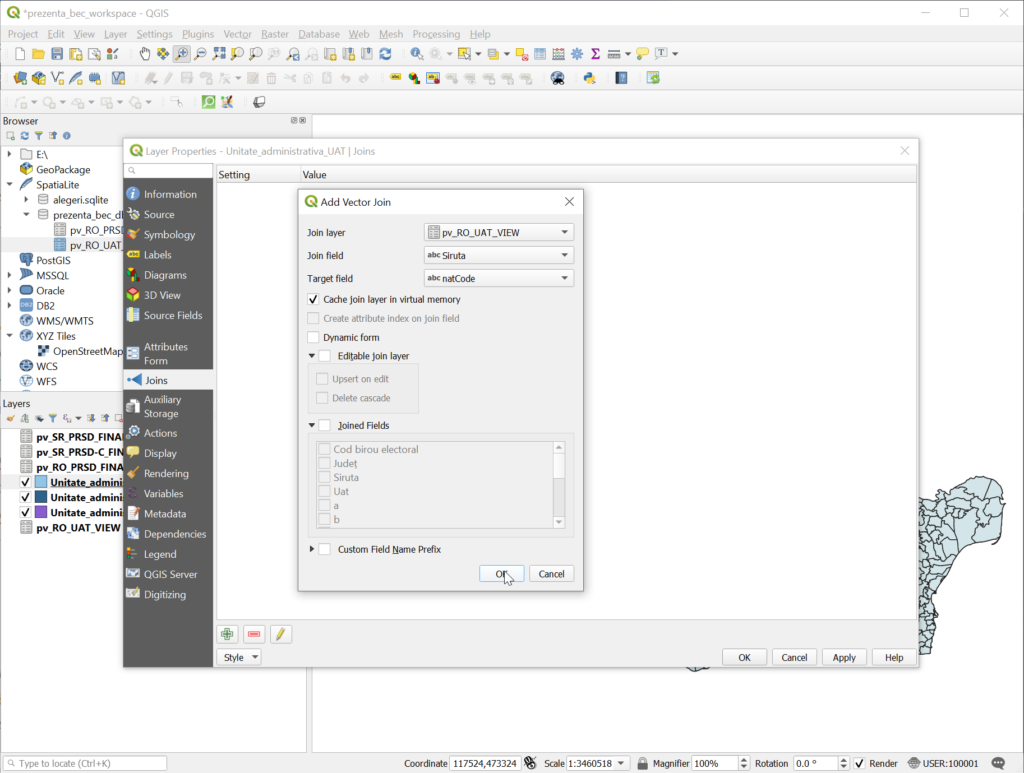
Right Click on Unitate_administrativa_UAT, Properties, Joins, Add new join. Use pv_RO_UAT_VIEW as Join layer, Siruta as Join field, natCode as Target Field, and click Ok. Open Unitate_administrativa_UAT attribute table again, and you should see the new columns from the elections data added to each administrative unit.
The issues
If into the opened table we Click on pv_RO_uats_view_Cod birou electoral and sort the records ascending, we will find the places that did not join. They are the country capital sectors, and a city named BĂNEASA. Write down the natCode for each record, because we will need it later.
- BUCUREŞTI SECTORUL 1: 179141
- BUCUREŞTI SECTORUL 2: 179150
- BUCUREŞTI SECTORUL 3: 179169
- BUCUREŞTI SECTORUL 4: 179178
- BUCUREŞTI SECTORUL 5: 179187
- BUCUREŞTI SECTORUL 6: 179196
- BĂNEASA: 61069
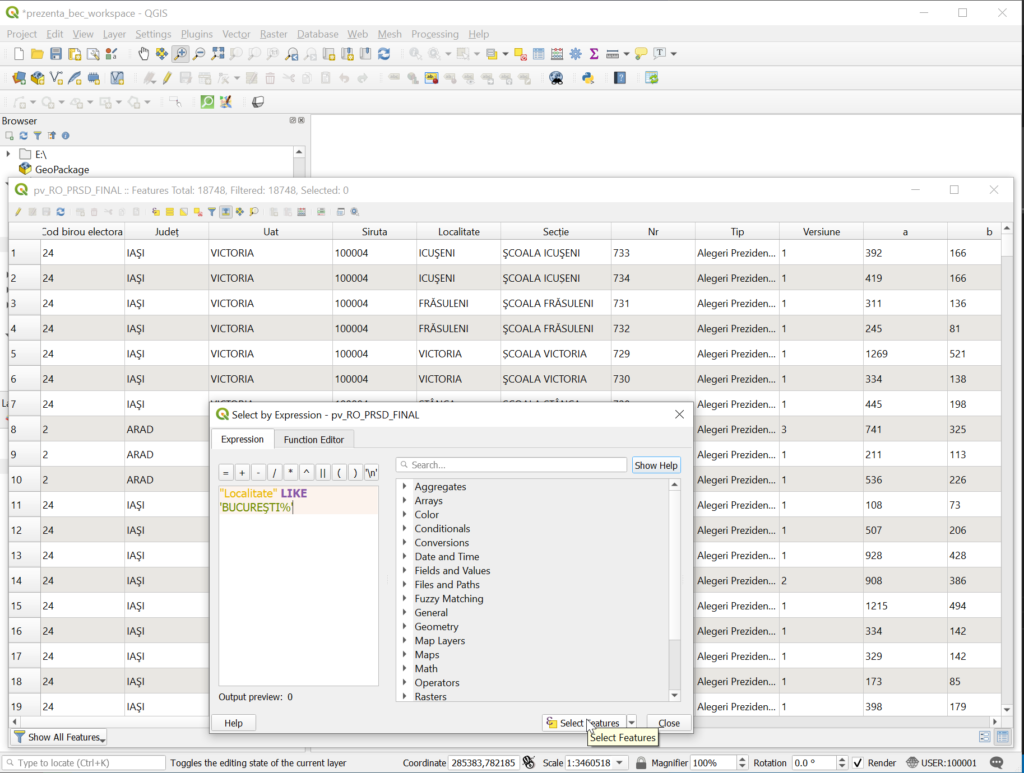
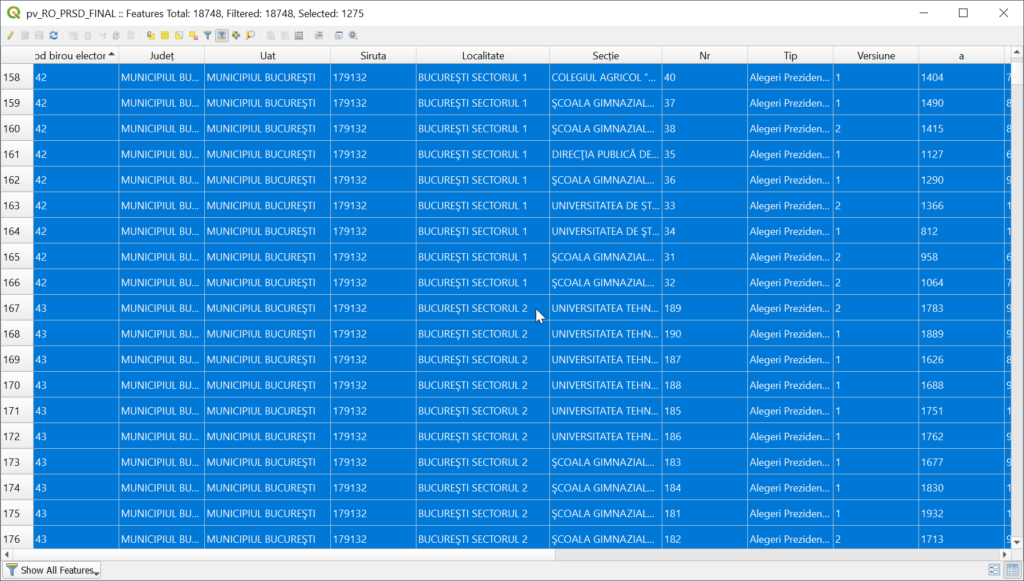
Let’s investigate why this data loss happened. Open the table for pv_RO_PSRD_FINAL, Click ‘Move selection to top’, then ‘Select features using an expression’, and type “Localitate” LIKE ‘BUCUREŞTI%’. We should see that all records have Siruta 179132. The only different fields are Cod birou electoral and Localitate, eg. BUCUREŞTI SECTORUL 1, BUCUREŞTI SECTORUL 2.
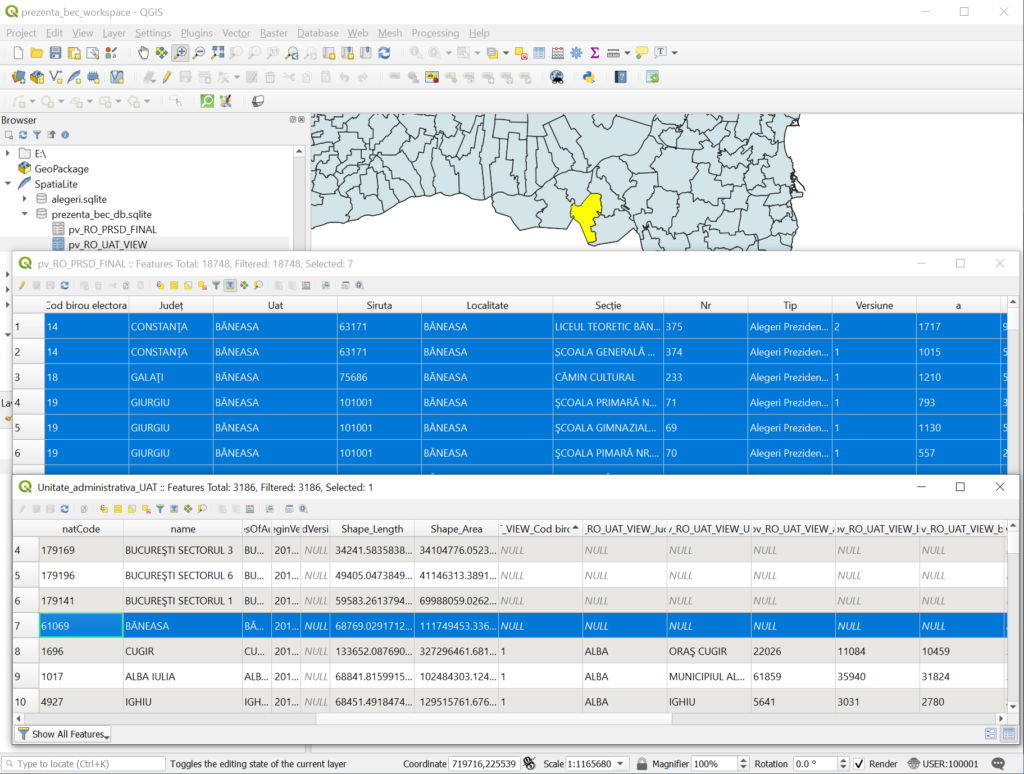
Let’s look at BĂNEASA record. It has natCode 61069 in Unitate_administrativa_UAT, and we can see on the map that the polygon is located in Constanța county. The only Băneasa in Constanța county from pv_RO_PSRD_FINAL has Siruta 63171.
Solve the issues using intermediate table
The quickest way to solve this issue and make a clean join between the geographic data and the elections data, and not alter the original tables, would be to create an intermediate table that contains an original Siruta and a modified Siruta that matches the faulty records.
Let’s go to DB Manager window, create a new table pv_RO_SIRUTA_MODIFY that contains the id, Siruta, Localitate from pv_RO_PSRD_FINAL. Then add a field named Siruta_Mod and update it from Siruta.
CREATE TABLE pv_RO_SIRUTA_MODIFY AS
	SELECT id, Siruta, Localitate FROM pv_RO_PRSD_FINAL;

ALTER TABLE pv_RO_SIRUTA_MODIFY
	ADD COLUMN Siruta_Mod INTEGER;

UPDATE pv_RO_SIRUTA_MODIFY
	SET Siruta_Mod = Siruta;
Update Siruta_Mod for the faulty records above:
UPDATE pv_RO_SIRUTA_MODIFY
	SET Siruta_Mod = 61069
	WHERE Siruta = 63171;

UPDATE pv_RO_SIRUTA_MODIFY
	SET Siruta_Mod = 179141
	WHERE Siruta = 179132
	AND Localitate = 'BUCUREŞTI SECTORUL 1';
UPDATE pv_RO_SIRUTA_MODIFY
	SET Siruta_Mod = 179150
	WHERE Siruta = 179132
	AND Localitate = 'BUCUREŞTI SECTORUL 2';
UPDATE pv_RO_SIRUTA_MODIFY
	SET Siruta_Mod = 179169
	WHERE Siruta = 179132
	AND Localitate = 'BUCUREŞTI SECTORUL 3';
UPDATE pv_RO_SIRUTA_MODIFY
	SET Siruta_Mod = 179178
	WHERE Siruta = 179132
	AND Localitate = 'BUCUREŞTI SECTORUL 4';
UPDATE pv_RO_SIRUTA_MODIFY
	SET Siruta_Mod = 179187
	WHERE Siruta = 179132
	AND Localitate = 'BUCUREŞTI SECTORUL 5';
UPDATE pv_RO_SIRUTA_MODIFY
	SET Siruta_Mod = 179196
	WHERE Siruta = 179132
	AND Localitate = 'BUCUREŞTI SECTORUL 6';
After that, inspect the records for Bucharest and Băneasa in both tables:
SELECT *
	FROM pv_RO_PRSD_FINAL
	WHERE Siruta = 179132 OR Siruta = 63171
	GROUP BY `Localitate`
	ORDER BY `Localitate`;

SELECT *
	FROM pv_RO_SIRUTA_MODIFY
	WHERE Siruta = 179132 OR Siruta = 63171
	GROUP BY `Localitate`
	ORDER BY `Localitate`;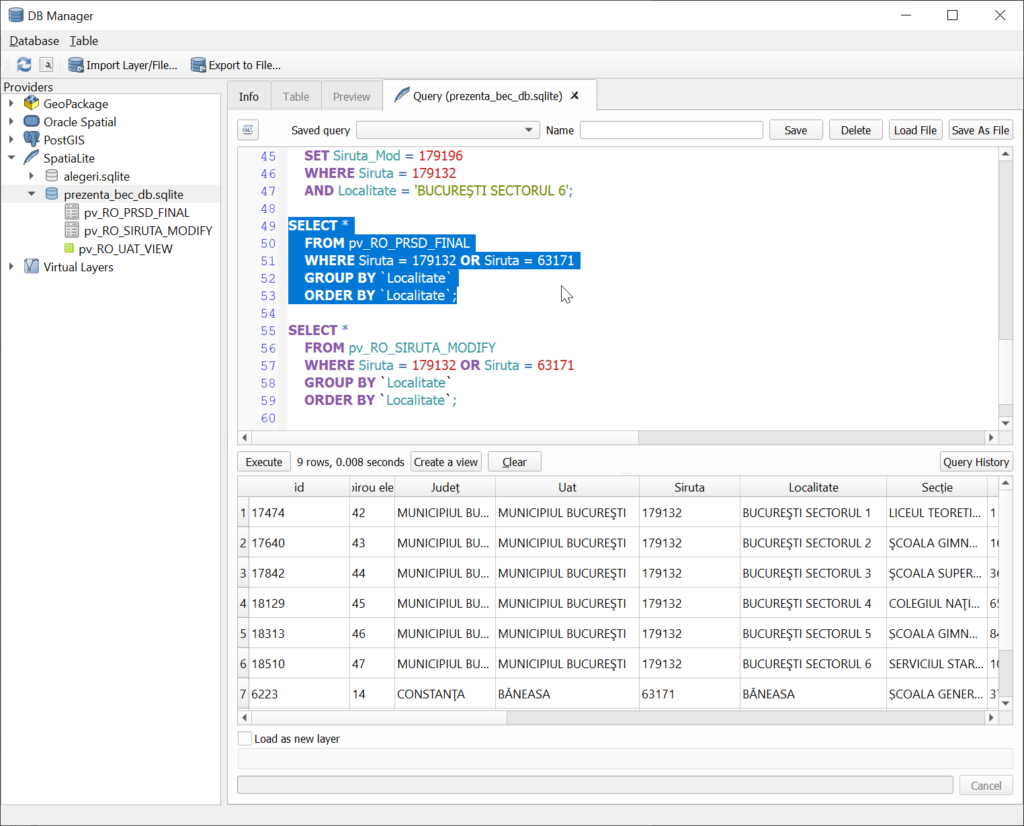
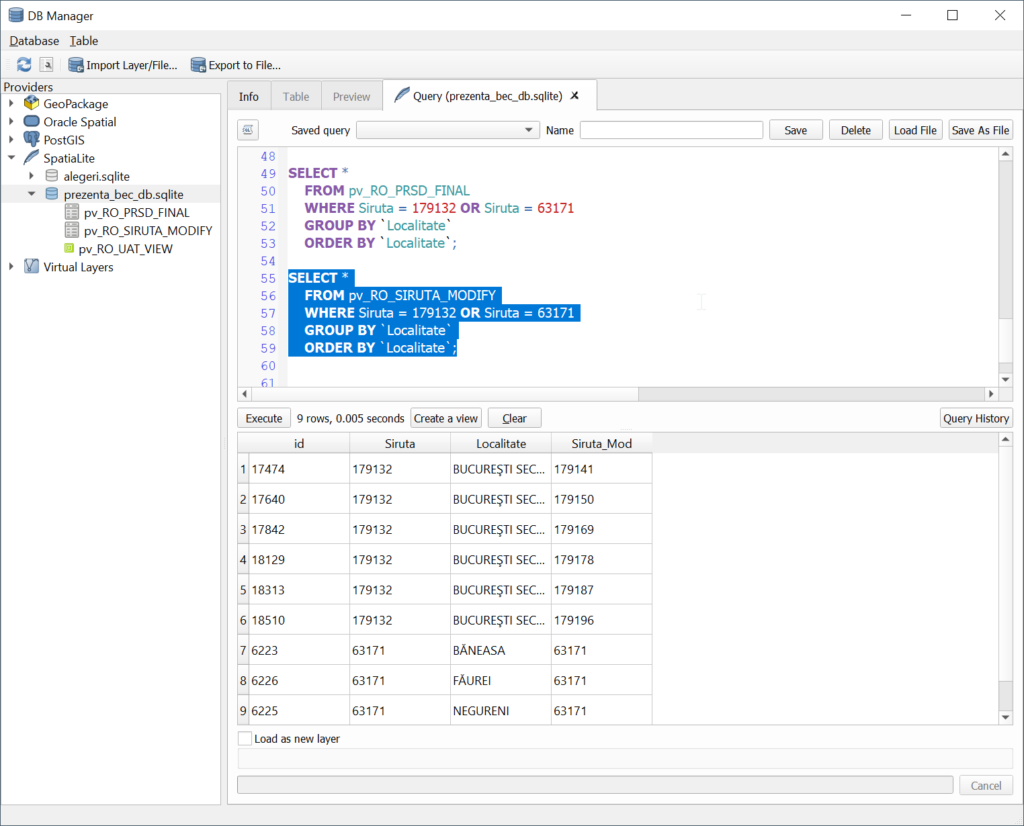
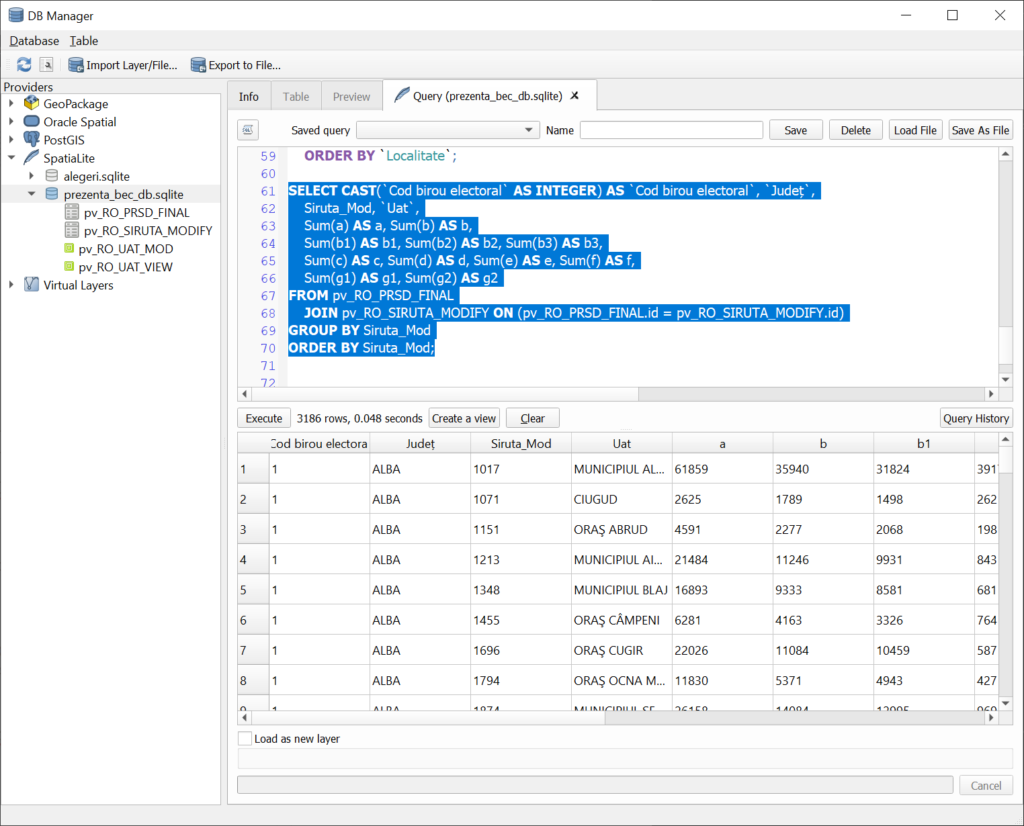
Now, we can create a new view, pv_RO_UAT_MOD , with aggregated data from the elections. This time we will group the data using Siruta_Mod, and id to join pv_RO_SIRUTA_MODIFY with pv_RO_PRSD_FINAL:
SELECT CAST(`Cod birou electoral` AS INTEGER) AS `Cod birou electoral`, `Județ`,
	Siruta_Mod, `Uat`,
	Sum(a) AS a, Sum(b) AS b,
	Sum(b1) AS b1, Sum(b2) AS b2, Sum(b3) AS b3,
	Sum(c) AS c, Sum(d) AS d, Sum(e) AS e, Sum(f) AS f,
	Sum(g1) AS g1, Sum(g2) AS g2
FROM pv_RO_PRSD_FINAL
	JOIN pv_RO_SIRUTA_MODIFY ON (pv_RO_PRSD_FINAL.id = pv_RO_SIRUTA_MODIFY.id)
GROUP BY Siruta_Mod
ORDER BY Siruta_Mod;
There are 3186 records in pv_RO_UAT_MOD, and that means that the issue with the missing data was solved.
Joining back to the spatial data
We will try again to join Unitate_administrativa_UAT with the elections data, this time using Siruta_Mod from pv_RO_UAT_MOD. This way we will have elections data for Bucharest sectors and Băneasa, too.
Add pv_RO_UAT_MOD to canvas, remove all joins to Unitate_administrativa_UAT , and let’s add the new join:
- Join layer: pv_RO_UAT_MOD
- Join field: Siruta_Mod
- Target field: natCode
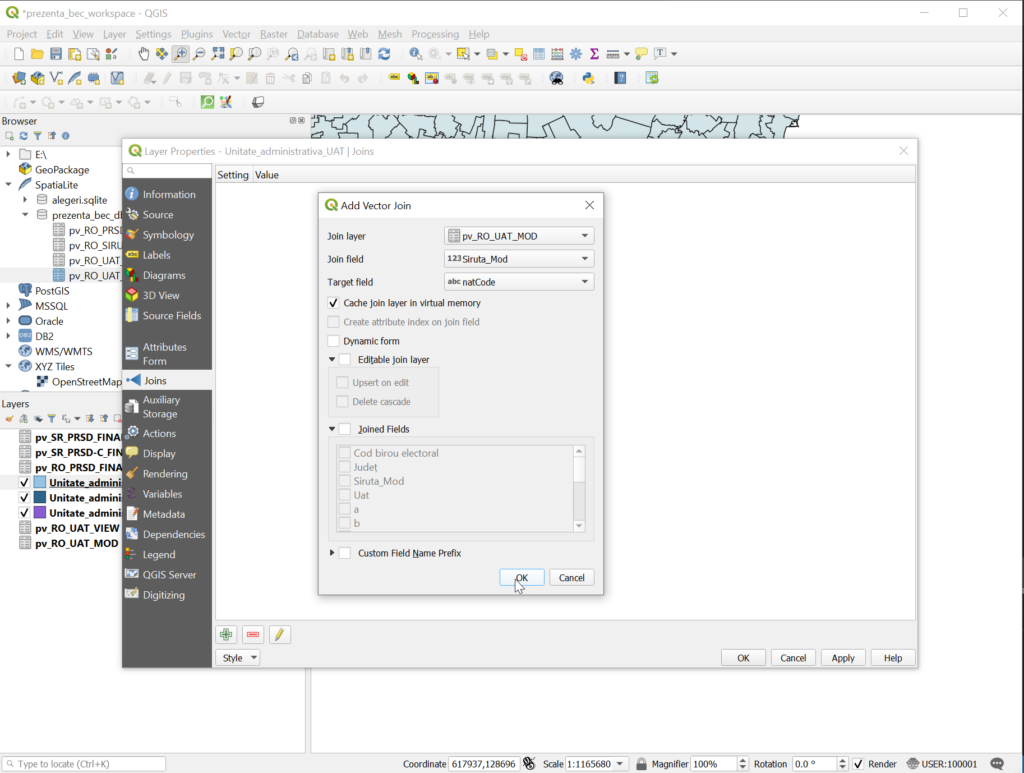
If you open the table Unitate_administrativa_UAT you will see all records for Bucharest and Băneasa are populated in the joined fields.
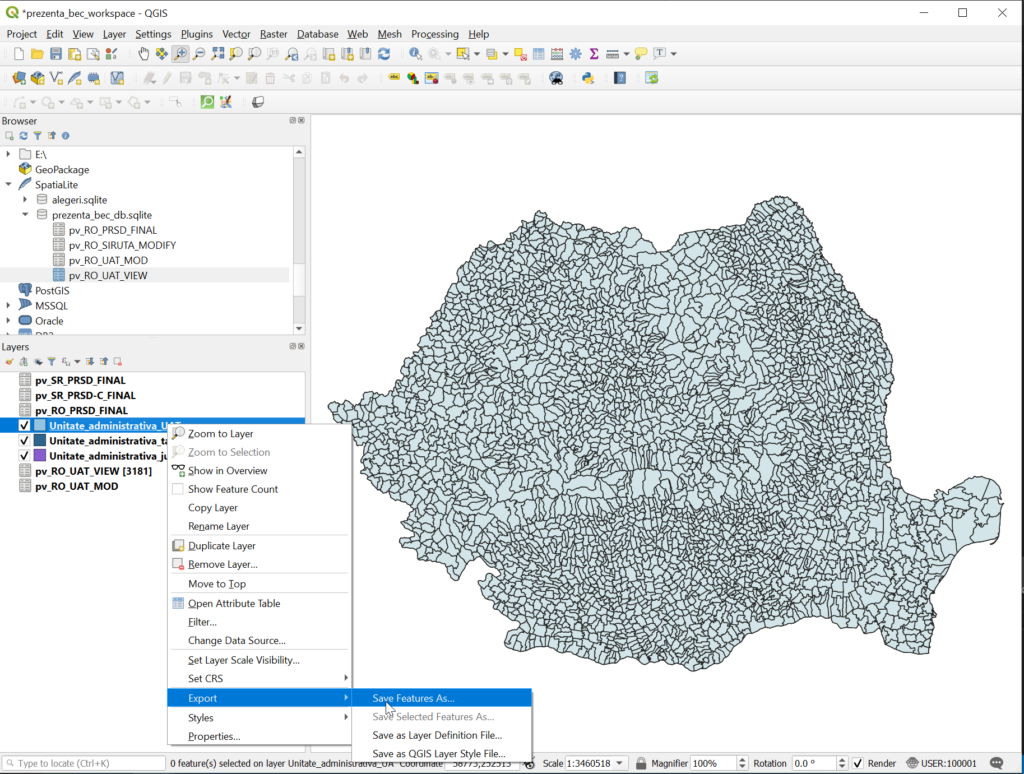
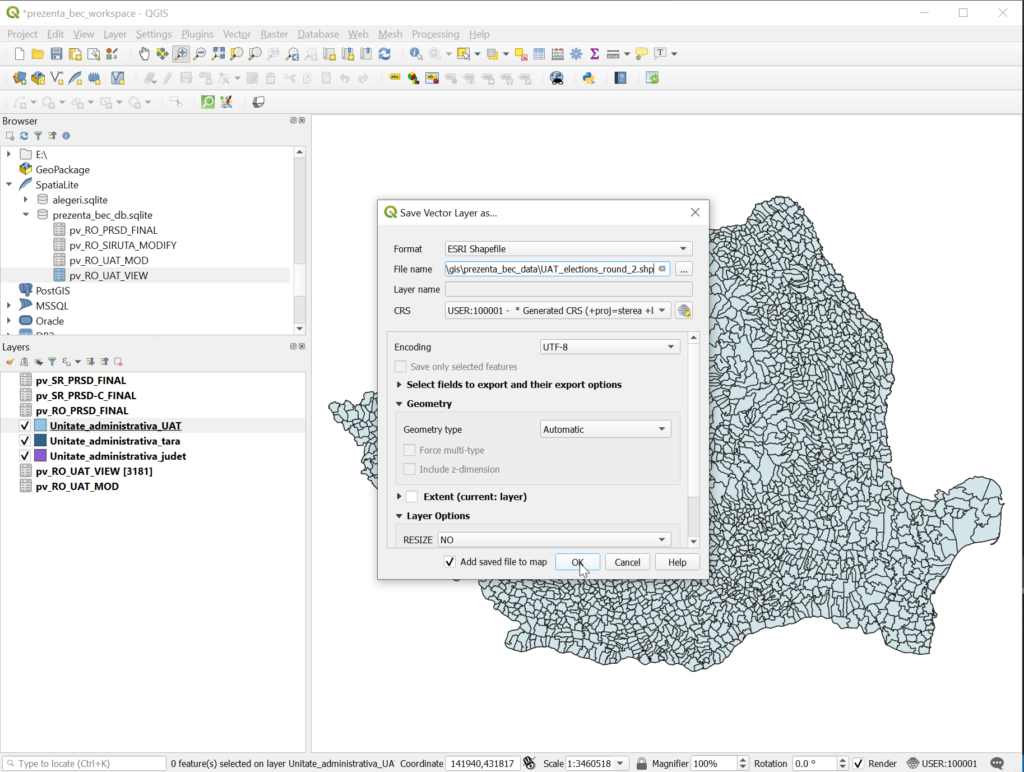
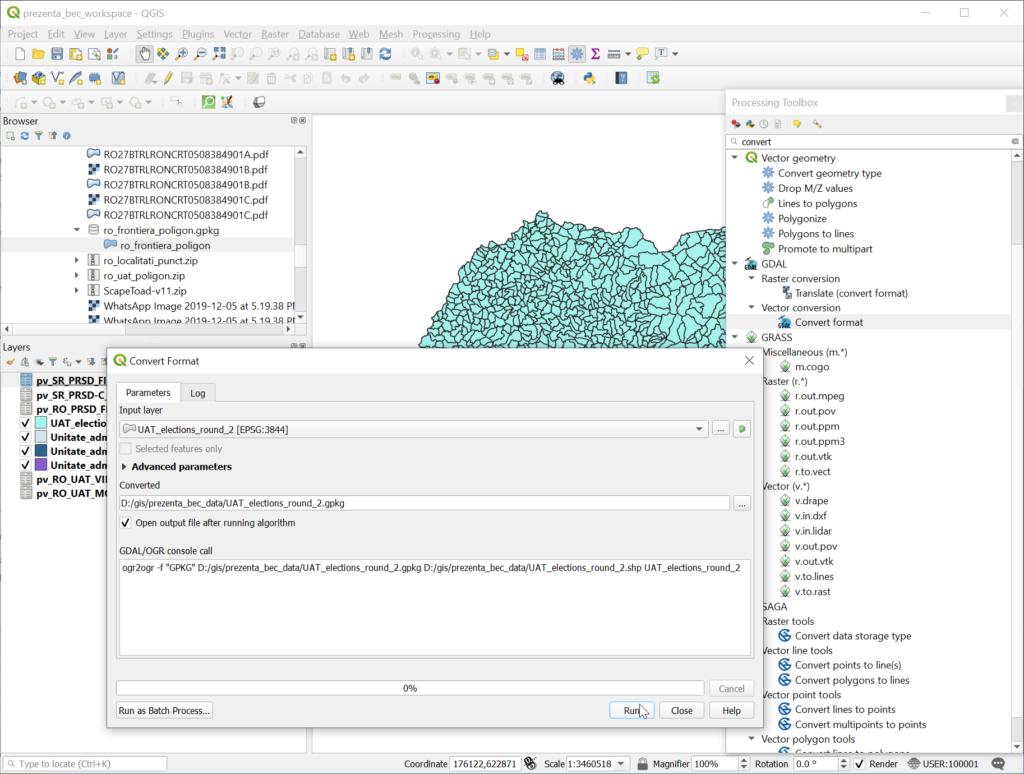
In order to keep the joined columns, Right Click on the layer, Export, Save Features As, choose ‘ESRI shapefile’ and save the file as UAT_elections_round_2.
Next, we will do some data cleaning, and after that we will have the final file that gathers both the geographic data and the elections data at administrative units level.
Final touches
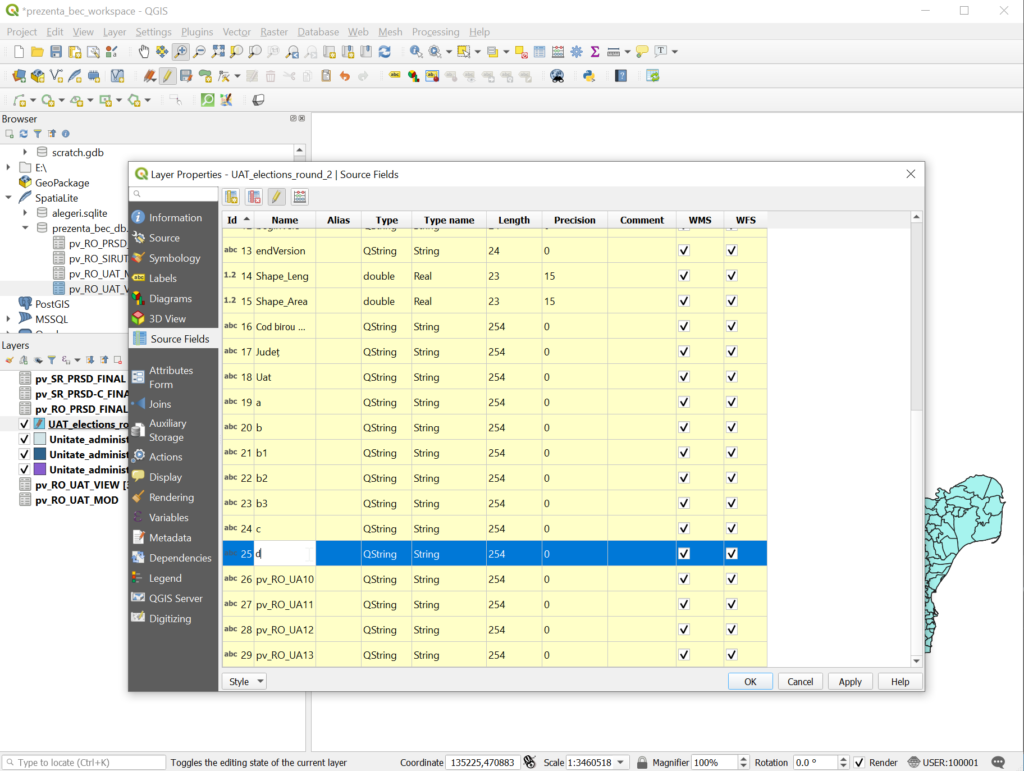
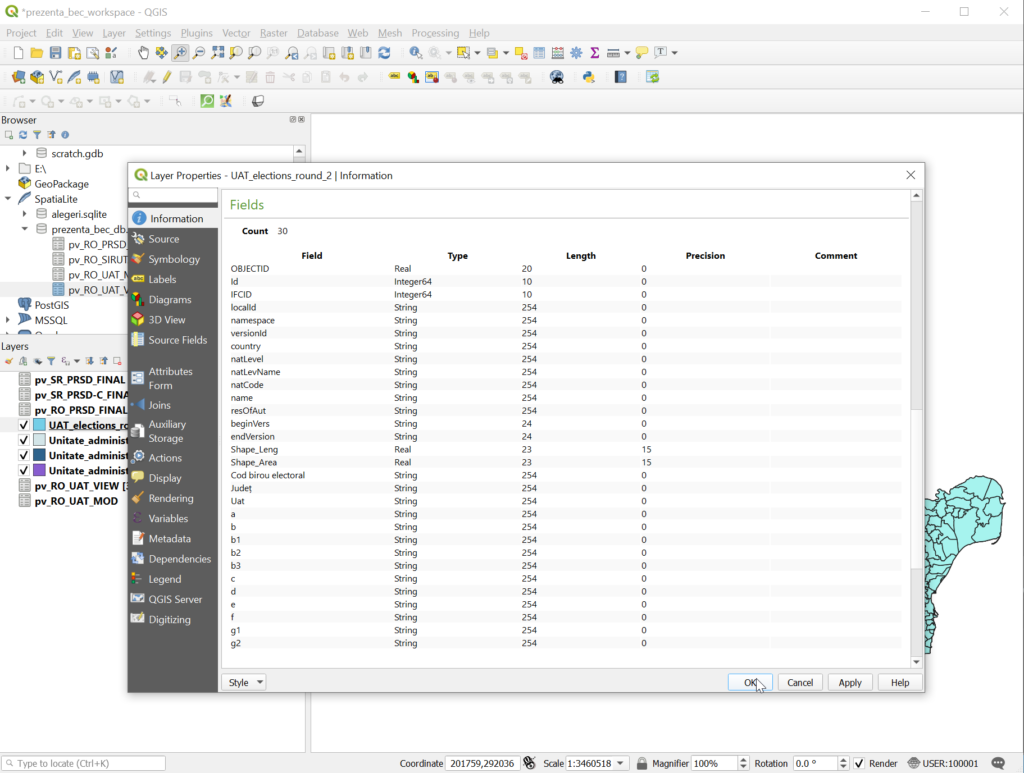
Right Click on Unitate_administrativa_UAT , Properties, Information, and save the content under Fields in a txt file. We will look at the file when we will rename the fields for UAT_elections_round_2, because they were truncated during the export.
OBJECTID
Id
IFCID
localId
namespace
versionId
country
natLevel
natLevName
natCode
name
resOfAut
beginVers
endVersion
Shape_Length
Shape_Area
pv_RO_UAT_MOD_Cod birou electoral
pv_RO_UAT_MOD_Județ
pv_RO_UAT_MOD_Uat
pv_RO_UAT_MOD_a
pv_RO_UAT_MOD_b
pv_RO_UAT_MOD_b1
pv_RO_UAT_MOD_b2
pv_RO_UAT_MOD_b3
pv_RO_UAT_MOD_c
pv_RO_UAT_MOD_d
pv_RO_UAT_MOD_e
pv_RO_UAT_MOD_f
pv_RO_UAT_MOD_g1
pv_RO_UAT_MOD_g2
The intention is to keep the original fields from Unitate_administrativa_UAT and rename the fields coming from pv_RO_UAT_MOD.
Right click on UAT_elections_round_2, Properties, Source Fields, toggle editing, and rename pv_RO_UAT_ to ‘Cod birou electoral’, pv_RO_UA_1 to ‘Județ’ and so on.
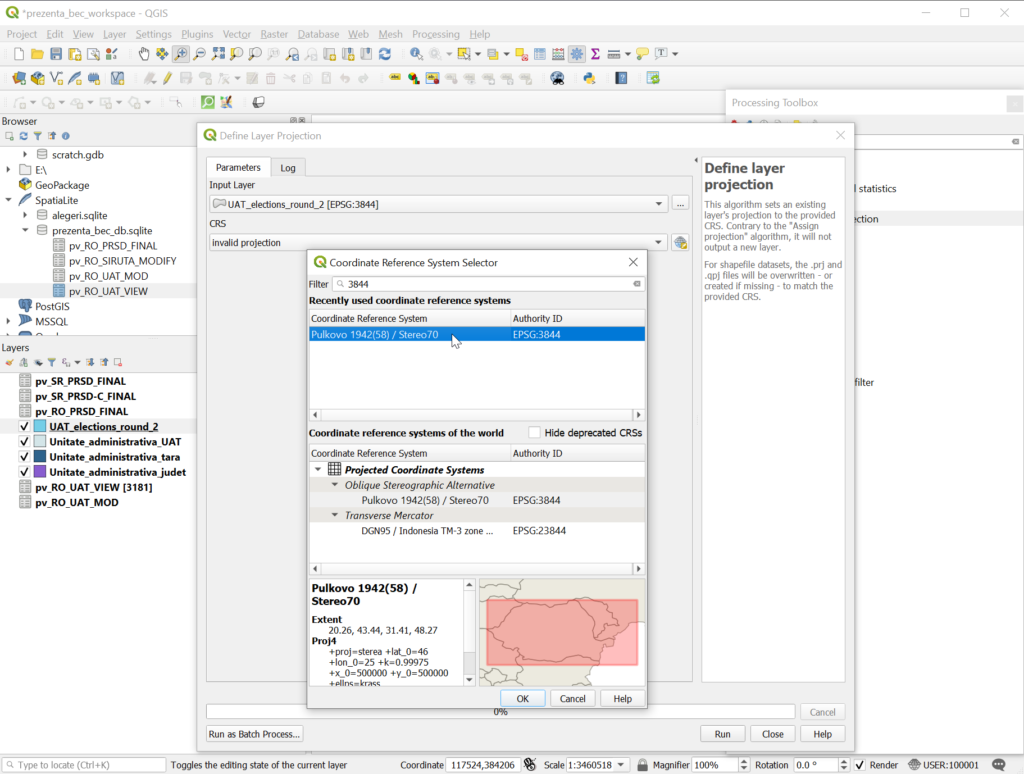
Among the last touches, we define the file projection, EPSG:3844 – Pulkovo 1942(58) / Stereo70 – Projected, and add a field, pv_siruta, where we insert the original Siruta for the records with issues, as it shows up in pv_RO_PRSD_FINAL.
Aslo, it is good practice to write some metadata for the file, so that people (inlcuding your future-self) can understand what the data are about.
Romania 2019 Presidential Elections - Geographic data at UAT level, Round 2
Data sources:
- The geometries were created by ANCPI and published on Geoportalul INSPIRE al României and on Portalul de date deschise al Guvernului României.
- The attribute table was complemented with open data from Biroul Electoral Central on Prezenta BEC.
- The data can be reused under the Open Government License.
Author: Cristina Alexa
Date: 2019-12-07
Files:
- Administrative units of polygon type, from the Unitate_administrativa_UAT layer, from http://geoportal.ancpi.ro/portal/apps/webappviewer/index.html?id=faeba2d173374445b1f13512bd477bb2
- Final elections results from the second round, 24th of November 2019, from the file pv_RO_PRSD_FINAL.csv, from https://prezenta.bec.ro/prezidentiale24112019/romania-pv-final
Coordinate Systems:
- EPSG:3844 - Pulkovo 1942(58) / Stereo70 - Projected
- EPSG:4326 - WGS 84 - Geographic
Methods:
Data processing was made in QGIS 3.8.3-Zanzibar and Spatialite (in QGIS).
Geographic data and elections data were downloaded, then we proceeded to the aggregation of the elections results at UAT level (because they were at precinct level), in order to join the two data sets.
The data grouping from pv_RO_PRSD_FINAL was made on the Siruta field, in Spatialite, and a temporary view was created, pv_RO_UAT_VIEW.
Next, it was made the Join between Unitate_administrativa_UAT and pv_RO_UAT_VIEW, on Siruta = natCode.
There have resulted records without electoral data after the Join, the inspecion of the causes followed up.
It was found that:
In pv_RO_PRSD_FINAL, Bucharest sectors have Siruta 179132, Băneasa city from Constanța has Siruta 63171
In Unitate_administrativa_UAT:
BUCUREŞTI SECTORUL 1: 179141
BUCUREŞTI SECTORUL 2: 179150
BUCUREŞTI SECTORUL 3: 179169
BUCUREŞTI SECTORUL 4: 179178
BUCUREŞTI SECTORUL 5: 179187
BUCUREŞTI SECTORUL 6: 179196
BĂNEASA: 61069
The issue was solved by using an intermediate field, Siruta_Mod. An intermediary table was created from pv_RO_UAT_VIEW, pv_RO_UAT_MOD, a field Siruta_Mod was added and updated from Siruta, but for Bucharest and Băneasa the codes above were inserted.
The Join with Unitate_administrativa_UAT was made again, this time with pv_RO_UAT_MOD, and there have resulted 3186 completely populated rows.
Results:
The resulting file from the Join was exported as ESRI shapefile, named UAT_elections_round_2, with EPSG 3844 and UTF8 encoding.
Finally, a new field, pv_siruta was added, in which there are recorded the original Siruta codes for București and Băneasa from pv_RO_PRSD_FINAL.
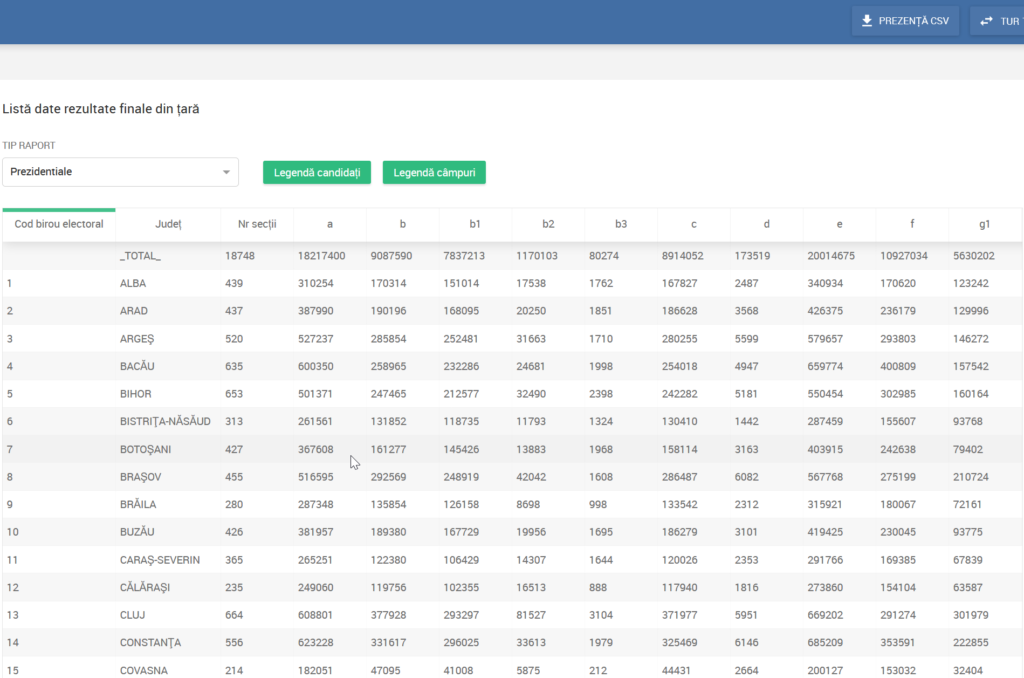
The results were checked by queries in Spatialite and cross-checking with the final results and the UAT level results from https://prezenta.bec.ro.
Other considerations:
The aggregation of the electoral data at Siruta (natCode) level was chosen because it followed the structure from the geographic file from ANCPI, and the use of a greater detail level was intended, from where the data could be generalized, if needed.
The aggregation at 'Siruta' level could be used in a similar way like in the electoral data file, using the Bucharest sectors together, dissolving the corresponding geometries from the geographic file.
The aggregation at 'Cod birou electoral' level could also be used, and them we would have dissolved the geometries at county level, and keep the Bucharest sectors undissolved.
We could get to the two generalization levels from above starting from the UAT_elections_round_2 file, too.Testing the results
We can test our results doing queries in DB Manager, then going to prezenta.bec.ro and checking the total results either for a specific UAT, or for a whole electoral district:
SELECT 'a', Sum(a) AS sum FROM pv_RO_UAT_MOD WHERE `Cod birou electoral` = 1 UNION
    SELECT 'b', Sum(b) AS sum FROM pv_RO_UAT_MOD WHERE `Cod birou electoral` = 1 UNION
    SELECT 'b1', Sum(b1) AS sum FROM pv_RO_UAT_MOD WHERE `Cod birou electoral` = 1 UNION
    SELECT 'b2', Sum(b2) AS sum FROM pv_RO_UAT_MOD WHERE `Cod birou electoral` = 1 UNION
    SELECT 'b3', Sum(b2) AS sum FROM pv_RO_UAT_MOD WHERE `Cod birou electoral` = 1 UNION
    SELECT 'c', Sum(c) AS sum FROM pv_RO_UAT_MOD WHERE `Cod birou electoral` = 1 UNION
    SELECT 'd', Sum(d) AS sum FROM pv_RO_UAT_MOD WHERE `Cod birou electoral` = 1 UNION
    SELECT 'e', Sum(e) AS sum FROM pv_RO_UAT_MOD WHERE `Cod birou electoral` = 1 UNION
    SELECT 'f', Sum(f) AS sum FROM pv_RO_UAT_MOD WHERE `Cod birou electoral` = 1 UNION
    SELECT 'g1', Sum(g1) AS sum FROM pv_RO_UAT_MOD WHERE `Cod birou electoral` = 1 UNION
    SELECT 'g2', Sum(g2) AS sum FROM pv_RO_UAT_MOD WHERE `Cod birou electoral` = 1
ORDER BY 'a';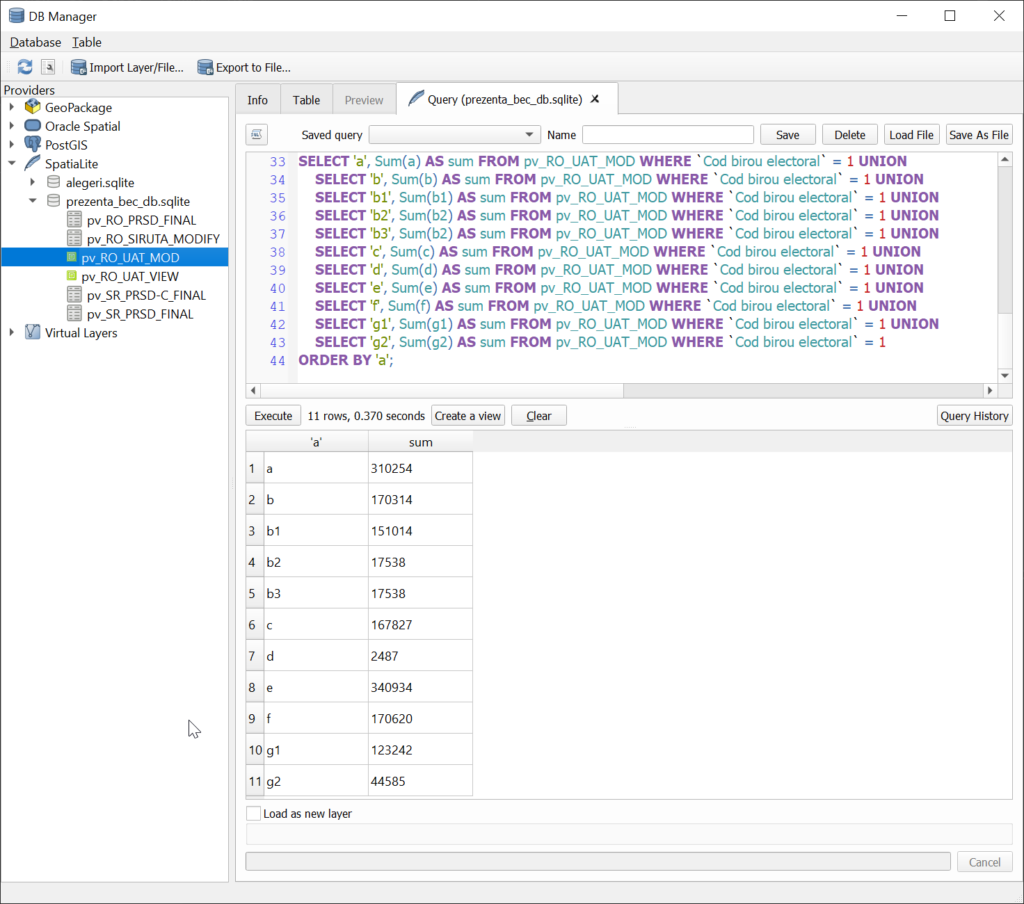
SELECT 'a', Sum(a) AS sum FROM pv_RO_UAT_MOD WHERE `Siruta_Mod` = 2130 UNION
    SELECT 'b', Sum(b) AS sum FROM pv_RO_UAT_MOD WHERE `Siruta_Mod` = 2130 UNION
    SELECT 'b1', Sum(b1) AS sum FROM pv_RO_UAT_MOD WHERE `Siruta_Mod` = 2130 UNION
    SELECT 'b2', Sum(b2) AS sum FROM pv_RO_UAT_MOD WHERE `Siruta_Mod` = 2130 UNION
    SELECT 'b3', Sum(b2) AS sum FROM pv_RO_UAT_MOD WHERE `Siruta_Mod` = 2130 UNION
    SELECT 'c', Sum(c) AS sum FROM pv_RO_UAT_MOD WHERE `Siruta_Mod` = 2130 UNION
    SELECT 'd', Sum(d) AS sum FROM pv_RO_UAT_MOD WHERE `Siruta_Mod` = 2130 UNION
    SELECT 'e', Sum(e) AS sum FROM pv_RO_UAT_MOD WHERE `Siruta_Mod` = 2130 UNION
    SELECT 'f', Sum(f) AS sum FROM pv_RO_UAT_MOD WHERE `Siruta_Mod` = 2130 UNION
    SELECT 'g1', Sum(g1) AS sum FROM pv_RO_UAT_MOD WHERE `Siruta_Mod` = 2130 UNION
    SELECT 'g2', Sum(g2) AS sum FROM pv_RO_UAT_MOD WHERE `Siruta_Mod` = 2130
ORDER BY 'a';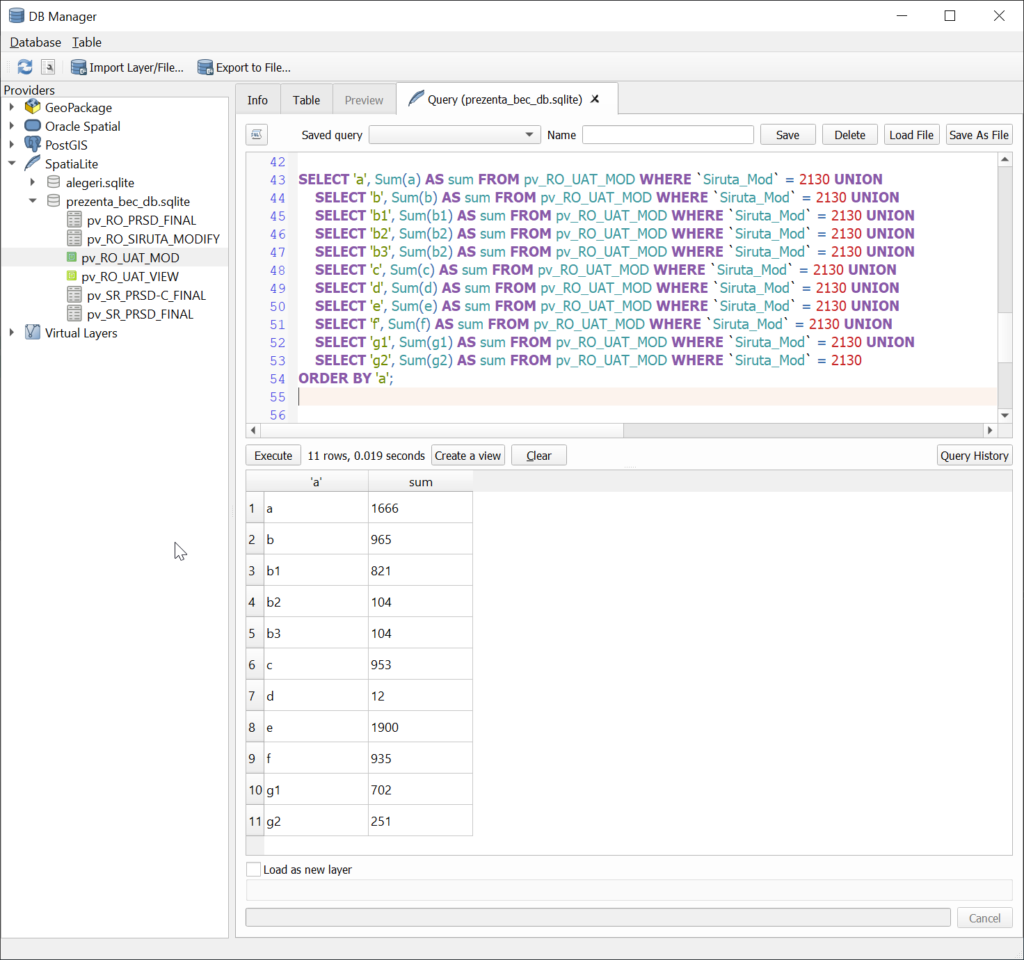
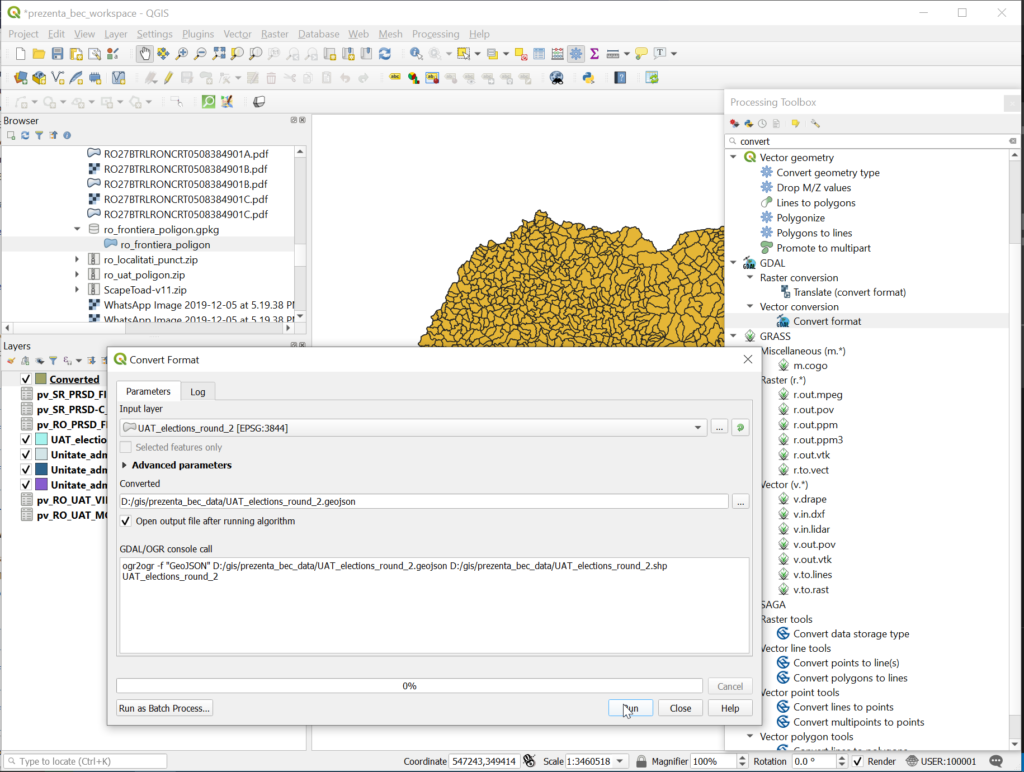
Export the file to multiple types and projections
If you want the data to be easy to use, it is a good idea to export the file as gpkg, geojson or kml, too.
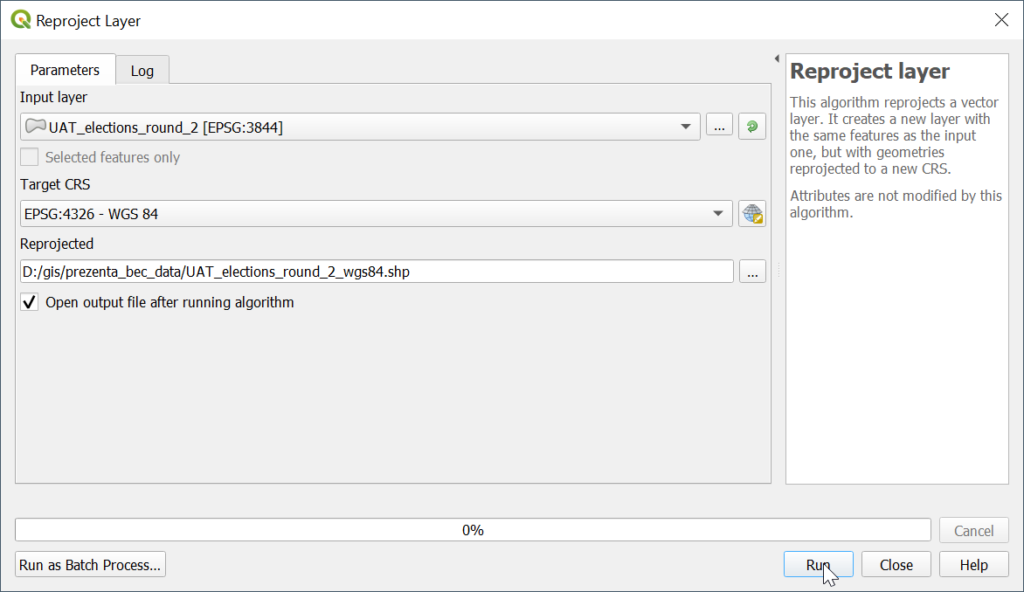
The file is in Stereo 70 coordinate system, specific to Romania (or EPSG 3844). We may want to reproject the files to WGS84 (EPSG 4326), too, so that we can blend our data with other latitude/longitude data.
In the end we will have the following file set:
- UAT_elections_round_2.zip, containing the minimum of 3 files that make up a shapefile, shp, shx, and dbf, and a projection file:
- UAT_elections_round_2.shp
- UAT_elections_round_2.shx
- UAT_elections_round_2.dbf
- UAT_elections_round_2.prj
- UAT_elections_round_2.gpkg
- UAT_elections_round_2.geojson
- UAT_elections_round_2_wgs84.zip
- UAT_elections_round_2_wgs84.gpkg
- UAT_elections_round_2_wgs84.geojson
- UAT_elections_round_2.qmd (the metadata file)
Final thoughts
That’s it, we got a file containing elections data with spatial information, at administrative units level. For now, you can download the resulting shapefiles from https://github.com/alexaac/Presidentials2019Data/tree/master/round_2 , and use https://mapshaper.org/ to make other conversions.
More on how to dissolve the data to county level, use elections data from abroad, or map yet more detailed data from prezenta.bec.ro, in another tutorial. 🙂