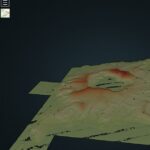
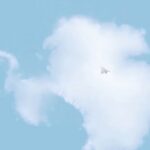
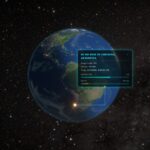
Day 6: RAMP 200 m Antarctic ice-surface elevation in Three.js, textured as clouds. Spatial structure intact, realism optional. #100DayMapChallenge.
Closing One Chapter, Opening Another: #100DayMapChallenge
It is the end of an era, and the beginning of a new one. Starting February 9, I am launching #100DayMapChallenge: 100 days revisiting the projects that shaped my transition from traditional GIS to interactive 3D visualization.
Styling elevation models in QGIS – Blue scale 🔷
#30DayMapChallenge Day 8. Blue Blue scale 🔷 In this post, I’ll talk a bit about styling elevation models in QGIS, giving as an example one of the maps I have made for the #30DayMapChallenge on Twitter in 2021. You can…
Autumn 🍂
#30DayMapChallenge Day 2. Lines Autumn – coloring streams by their flow order in QGIS 🍂 Here’s one of the maps I have made for the #30DayMapChallenge on Twitter in 2021. You can find out more about the challenge and my…
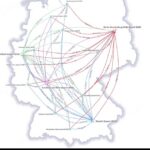
3D globe map in D3.js – Populated Places on Earth 🌍
#30DayMapChallenge Day 1. Points Populated Places on Earth 🌍 This is a 3D globe map in D3.js and Canvas, that I have made for the #30DayMapChallenge on Twitter in 2021. You can find out more about the challenge and my…
3D hexagons in QGIS – A tutorial in pictures
This is a tutorial about deriving 3D hexagons from an elevation model in QGIS and visualizing them in Threejs using Qgis2threejs. During the #30DayMapChallenge 2021 on Twitter, when I was preparing the map for day 5, Hexagons, I wanted to…
LiDAR PDAL Experiments – Taal Volcano
Those are my notes on taking some LiDAR data and testing different commands in PDAL. If you like, you can follow along using your own data. Probably I’ll de adding or deleting stuff, but you can take a look to…
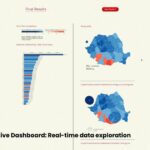
Elections Data – Spatial Perspectives in QGIS 3.8.3
Last week I wrote about making maps using results from the Presidential Elections that took place on the 10th and the 24th of November in Romania. In this post I will describe how we can process the provided data to…