
Day 7: Mapping a restless volcano 🌋
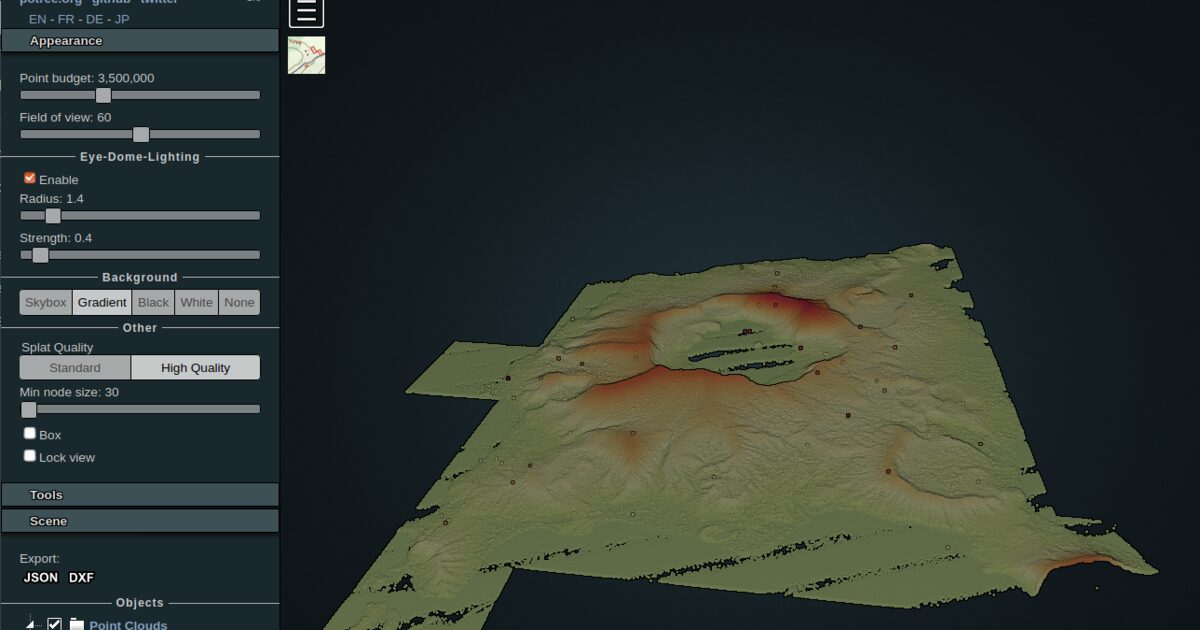
Taal Volcano in the Philippines is one of the most active volcanic systems in the world, its caldera sitting inside a lake formed by earlier eruptions. The PHIL-LiDAR Program captured high-resolution coverage across the region, producing 1-meter tiles, each representing a square kilometre of terrain.
I processed this data to explore how point clouds can document volcanic morphology and support hazard awareness. The density reveals crater structures, erosion patterns, and the complex relationship between cone and lake. Unlike Yosemite or Dublin, the context here isn’t recreation or urban form. It’s about understanding a landscape that may change again without warning. 💥
Working with data from active volcanic regions is a reminder that spatial data is never static. Terrain evolves. The dataset you process today may not match the ground tomorrow.
🗺️ This closes the first week of GIS foundations. Next week, the focus shifts toward interactivity and the D3.js phase.
Read more (2020 tutorial): LiDAR PDAL experiments – Taal Volcano
The project
Week 1 moved from web maps and climbing walls to PDAL at Yosemite and Dublin, then fire severity and Antarctic perception. Day 7 brings the same open LiDAR stack into a hazard landscape.
Data: Taal Open LiDAR via UP TCAGP / PHIL-LiDAR. Multiple 1 m LAZ tiles (1000×1000 m each). Campaign notes cite on the order of 35 files and ~172 million points. Coverage captures cone, caldera, and lake relationships that matter for morphology reading, not tourism.
Why Taal is different in the series
| Day | Place | Motive |
|---|---|---|
| 2-3 | Yosemite | Terrain / climbing walls / pipeline skill |
| 5 | Dublin | Urban form, open data across borders |
| 7 | Taal | Volcanic morphology, hazard awareness, change |
The tools overlap (PDAL, Entwine, Potree, QGIS). The stakes do not. A point cloud here is a snapshot of ground that may not survive the next eruption cycle unchanged.
Workflow (same family as Days 3 and 5)
| Stage | Role at Taal |
|---|---|
| Filter / classify | Clean acquisition noise; separate ground and structure where useful |
| Index (Entwine) | Make multi-tile coverage streamable |
| Potree | Inspect crater walls, lake edge, erosion patterns in browser |
| QGIS / bash | Checks and batch across 1 m tiles |
Honest constraint: LiDAR dated before later activity is a baseline, not a live hazard product. Useful for structure and awareness; not a substitute for official monitoring.
Tools
- PDAL / Entwine / Potree / QGIS / bash
- PHIL-LiDAR (UP TCAGP): 1 m LAZ tiles over Taal
Why this day matters in the series
Day 7 closes Week 1: GIS foundations. The arc was tools and honesty about scale: processing time, open data, urban vs mountain vs ice vs volcano. Week 2 shifts toward interactivity and the D3.js phase.
How to follow
- Blog: blog.maptheclouds.com
- LinkedIn: Day 7 post
- 2020 tutorial: PDAL experiments – Taal Volcano
- Previous: Day 6 – Antarctica clouds
- Hashtag: #100DayMapChallenge
#100DayMapChallenge · Day 7/100 · Taal Volcano · LinkedIn
Previous: Day 6: Antarctica Doesn’t Look Like This