
Day 8: Mapping where people live from space 🛰️
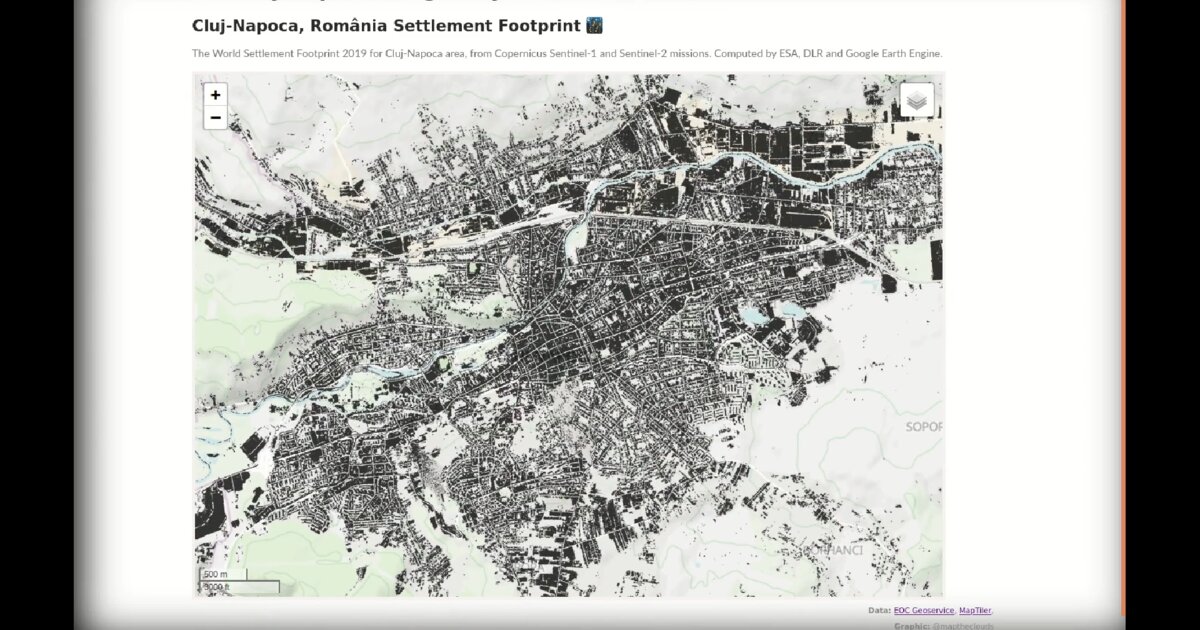
Cluj-Napoca, Romania. The World Settlement Footprint 2019 uses Copernicus Sentinel-1 and Sentinel-2 data to detect built-up areas worldwide at 10 m resolution. Produced by ESA, DLR, and Google Earth Engine, it combines radar and optical imagery to map human presence from orbit.
What makes this powerful isn’t only the scale of processing petabytes of satellite data. It’s that the results are openly available. Through Copernicus, anyone can study settlement patterns anywhere on Earth. 🌍
I used the dataset to explore urban expansion around my city, looking beyond administrative borders to see how the built footprint actually spreads. Open satellite analysis changes what’s possible for independent researchers, small teams, and curiosity-driven work like this.
Sometimes mapping starts with a local question and a global dataset.
Demo: Cluj urban/rural settlement map
The project
Week 2 opens the interactivity phase. After LiDAR pipelines and hazard morphology in Week 1, Day 8 is a web map on a global open layer, zoomed to a local question: where does Cluj’s built footprint actually go, past the city line on paper?
Dataset: World Settlement Footprint (WSF) 2019. Built-up detection at 10 m from Sentinel-1 (radar) and Sentinel-2 (optical), produced by ESA, DLR, and Google Earth Engine, distributed through the Copernicus ecosystem.
Why WSF fits this day
| Aspect | Detail |
|---|---|
| Resolution | 10 m built-up footprint |
| Sensors | Sentinel-1 + Sentinel-2 |
| Access | Open results, not only open raw scenes |
| Local use | Expansion pattern around Cluj-Napoca beyond admin borders |
| Stack | Leaflet interactive map |
Petabyte-scale processing sits upstream. What lands on the map for a small team is a usable layer and a question you can ask without a national mapping agency budget.
Tools
- World Settlement Footprint 2019 (ESA / DLR / Google Earth Engine)
- Copernicus Sentinel-1 / Sentinel-2 (source missions behind WSF)
- Leaflet: interactive exploration of the Cluj extent
Why this day matters in the series
Day 7 closed GIS foundations on Taal. Day 8 starts the turn toward interactivity: open satellite products + browser map + a hometown case. Local question, global dataset.
How to follow
- Blog: blog.maptheclouds.com
- LinkedIn: Day 8 post
- Live demo: urbanrural / Cluj WSF
- Previous: Day 7 – Taal Volcano
- Hashtag: #100DayMapChallenge
#100DayMapChallenge · Day 8/100 · Cluj settlement footprint · LinkedIn
Previous: Day 7: Mapping a Restless Volcano