
Day 9: A ball that rolls uphill… or does it? 🎱👀
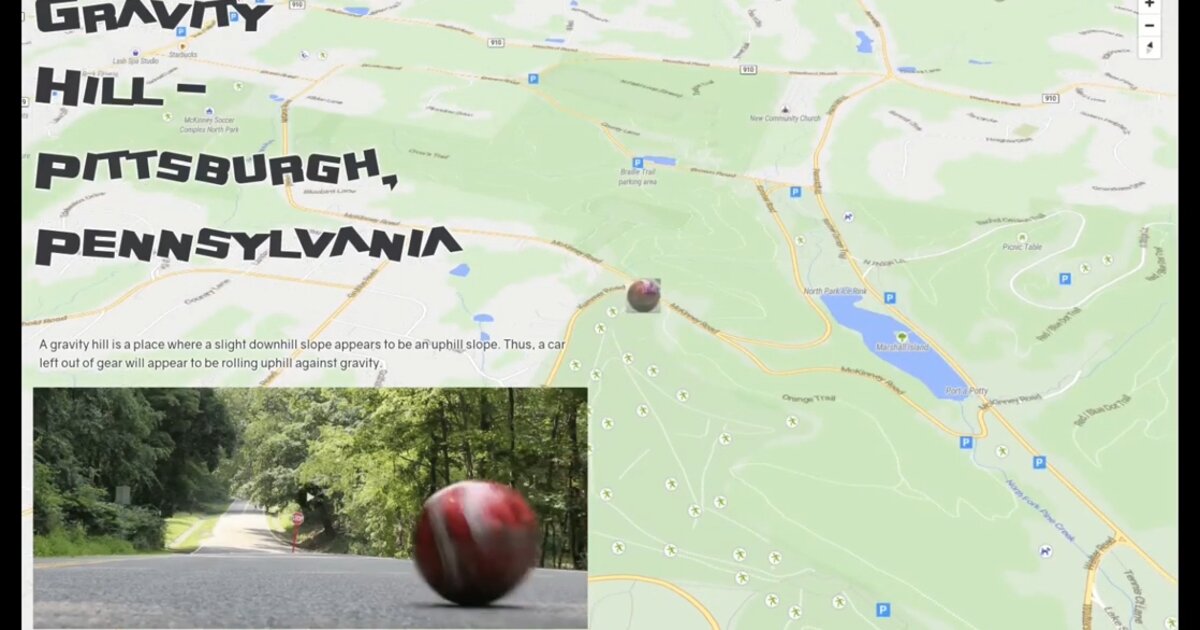
Gravity hills are places where terrain creates an optical illusion. A slight downhill slope appears to go uphill. Pittsburgh, Pennsylvania has one of the best-known examples. A ball or even a car left out of gear seems to roll against gravity.
I built a small web map using MapLibre GL and MapTiler data to show the location, then added video footage in the corner demonstrating the illusion. Your eyes insist the ball rolls uphill, even though physics says otherwise.
I also experimented with animation by making the map marker roll onto the screen when the page loads. A small detail, but it reinforces the playful nature of the phenomenon.
There are hundreds of gravity hills worldwide. They remind us that spatial perception is not just data and measurement. It is context, expectation, and sometimes a bit of wonder.
Live demo: Gravity Hill map · Video: YouTube
The project
After Cluj settlement footprints from orbit (Day 8), Day 9 is a smaller map with a larger perceptual twist. The geography is real. The reading of slope is not.
A gravity hill (also called a magnetic hill, mystery spot, or anti-gravity hill) is a layout of surrounding land that makes a slight downhill look like an uphill. Pittsburgh’s example is among the best known. The map pins the place; the corner video shows the ball. Physics stays downhill.
Stack
| Piece | Role |
|---|---|
| MapLibre GL | Interactive basemap and location |
| MapTiler | Map data / style |
| Corner video | Illusion proof for the viewer |
| Marker animation | Marker rolls onto screen on load |
The rolling marker is not analysis. It is interface rhyme: the page behaves a little like the story.
Why this day matters in the series
Week 2 is interactivity. Day 8 used a global open layer for a local urban question. Day 9 uses a local phenomenon to talk about spatial perception: context and expectation, not only measurement. Hundreds of gravity hills worldwide make the same point.
How to follow
- Blog: blog.maptheclouds.com
- LinkedIn: Day 9 post
- Live demo: Gravity Hill
- Previous: Day 8 – Cluj settlement footprint
- Hashtag: #100DayMapChallenge
#100DayMapChallenge · Day 9/100 · Gravity Hill · LinkedIn