
Day 11: When geography lies about votes 🗳️
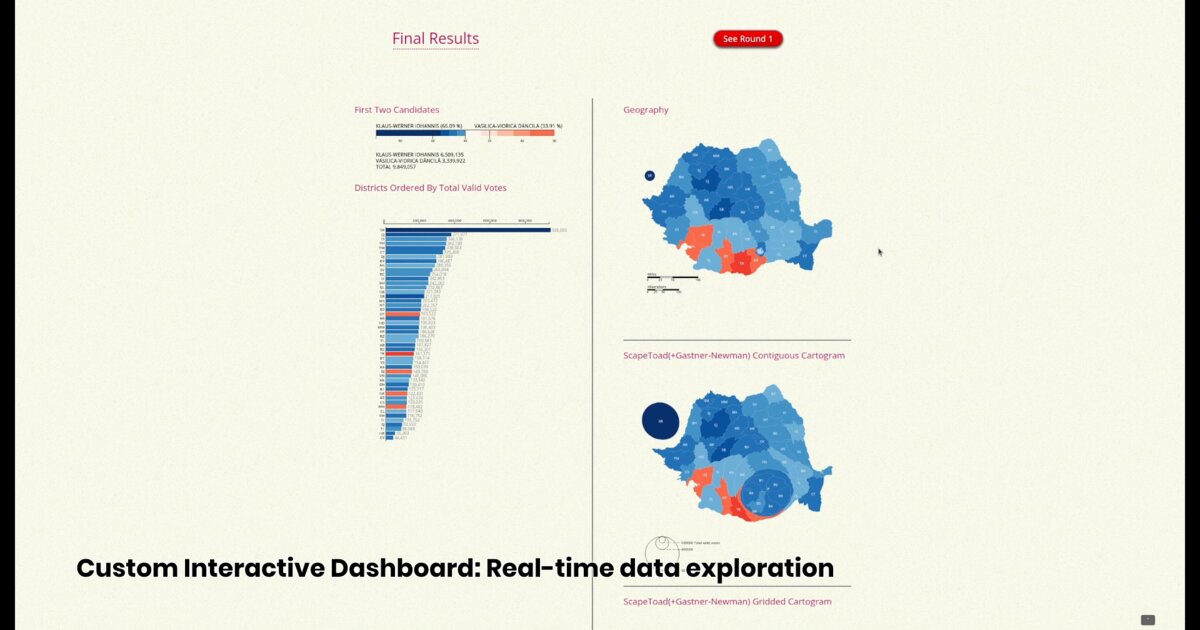
Romania’s 2019 Presidential Elections. This was one of my first complex web dashboards, and I was obsessed with cartograms (maps where size = data, not geography).
I experimented with FIVE different cartogram algorithms: • ScapeToad Contiguous (Gastner-Newman) • ScapeToad Gridded • Dorling Graphical (circles) • Demers Graphical (squares) • Non-Contiguous (featured)
The right panel scrolls through the normal map first, then all five cartograms below it, so you can compare each technique.
The data engineering was complex: joining ANCPI geometries with electoral data in QGIS + Spatialite, aggregating 3,186 voting stations to municipality level, fixing Siruta code inconsistencies for București sectors. Then Svelte + D3.js for the interactive dashboard with bar charts, donut chart, treemap, and Round 1 ↔ Round 2 toggle. 📊
Why cartograms? Bucharest (B1-B6) is tiny on a normal map but massive in votes. A county with empty forests looks the same as a dense city. Cartograms fix that. The distortion becomes information. 🌍
Inspired by Ralph Straumann’s brilliant Swiss cartogram work.
Live dashboard: For whom shall I vote?
The project
After H3 population without admin boxes (Day 10), Day 11 keeps the theme: geography can mislead when size ≠ weight. Here the weight is votes.
Cartograms resize districts by valid votes (or population proxy), not land area. Bucharest sectors swell. Sparse counties shrink. Color still carries candidate share per district; SR marks voters abroad.
Five algorithms, one comparison UI
| Algorithm | Form |
|---|---|
| ScapeToad Contiguous (Gastner-Newman) | Connected, area-distorted |
| ScapeToad Gridded | Contiguous, grid-constrained |
| Dorling | Circles |
| Demers | Squares |
| Non-Contiguous (featured) | Scaled shapes, gaps allowed |
The dashboard shows the geographic map first, then scrolls the five cartograms so the reader can compare technique, not only result.
Data engineering
| Step | Detail |
|---|---|
| Geometries | ANCPI |
| Votes | BEC / prezidentiale 2019 sources |
| Join / aggregate | QGIS + Spatialite: 3,186 stations → municipality |
| Codes | Siruta fixes for București sectors |
| Front end | Svelte + D3: bars, donut, treemap, Round 1 ↔ Round 2 |
Why this day matters in the series
Week 2 is interactivity and honest encoding. Day 11 is an early complex dashboard: cartography + ETL + UI. Distortion is not a bug. It is the message.
How to follow
- Blog: blog.maptheclouds.com
- LinkedIn: Day 11 post
- Live dashboard: for-whom-shall-i-vote-2
- Previous: Day 10 – Romania H3 population
- Hashtag: #100DayMapChallenge
#100DayMapChallenge · Day 11/100 · Romania elections cartograms · LinkedIn