• Skip to main navigation
  • Skip to main content
  • Skip to footer
MapTheClouds

MapTheClouds

GIS playground, 3D maps and data visualizations

  • About me
  • Home
  • Skip to menu toggle button

Tag: population

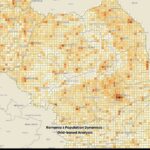
Day 29: Romania population density mosaic with Gridviz - #100DayMapChallenge

Day 29: Romania’s Population as a Mosaic

Posted on: March 9, 2026 Last updated on: August 4, 2026 Written by: MapTheClouds Comments: 0
Day 29: Romania population as a Gridviz mosaic. Density without administrative borders. Week 5 begins. #100DayMapChallenge.
Continue reading “Day 29: Romania’s Population as a Mosaic”…
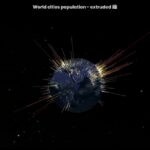
Day 16: World cities as population bars extruded on a Three.js globe - #100DayMapChallenge

Day 16: Higher Bars Mean More People – Cities on a Globe

Posted on: February 24, 2026 Last updated on: August 4, 2026 Written by: MapTheClouds Comments: 0
Day 16: First Three.js experiment: world cities as population bars on a globe. Extrusion turns density into landscape. #100DayMapChallenge.
Continue reading “Day 16: Higher Bars Mean More People – Cities on a Globe”…
3d-mapping 30daymapchallenge 30daymapchallenge 100daymapchallenge ArcGIS bash canvas cartography Climbing covid19 D3js dataviz docker docker-compose DTM Elevation Entwine geospatial gis Hillshade Hărți LiDAR linode linux map Maps maptheclouds migration mysql nginx OpenStreetMap PDAL Plasio Potree proxy public-health QGIS Qgis2threejs Romania ssl svelte Threejs vps WebGL wordpress

  • Diverse
  • Epic fails
  • Eșecuri
  • Evenimente
  • Events
  • Hărți
  • Învățare
  • Learning
  • Maps
  • Random
  • Resources
  • Resurse
  • Tutoriale
  • Tutorials

  • March 2026
  • February 2026
  • November 2022
  • February 2022
  • January 2022
  • November 2021
  • January 2021
  • December 2020
  • March 2020
  • February 2020
  • January 2020
  • December 2019
  • November 2019
  • September 2019

© 2021 MapTheClouds | Using Reykjavik theme. | Back to top ↑