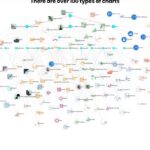
Day 20: A visual catalogue of chart types by relationship (comparison, distribution, correlation, part-to-whole, flow). Form follows the question. #100DayMapChallenge.
It is the end of an era, and the beginning of a new one. Starting February 9, I am launching #100DayMapChallenge: 100 days revisiting the projects that shaped my transition from traditional GIS to interactive 3D visualization.