
Day 69. Rainbow Cities 🌈
Height is not hard to render in 3D. It is hard to read.
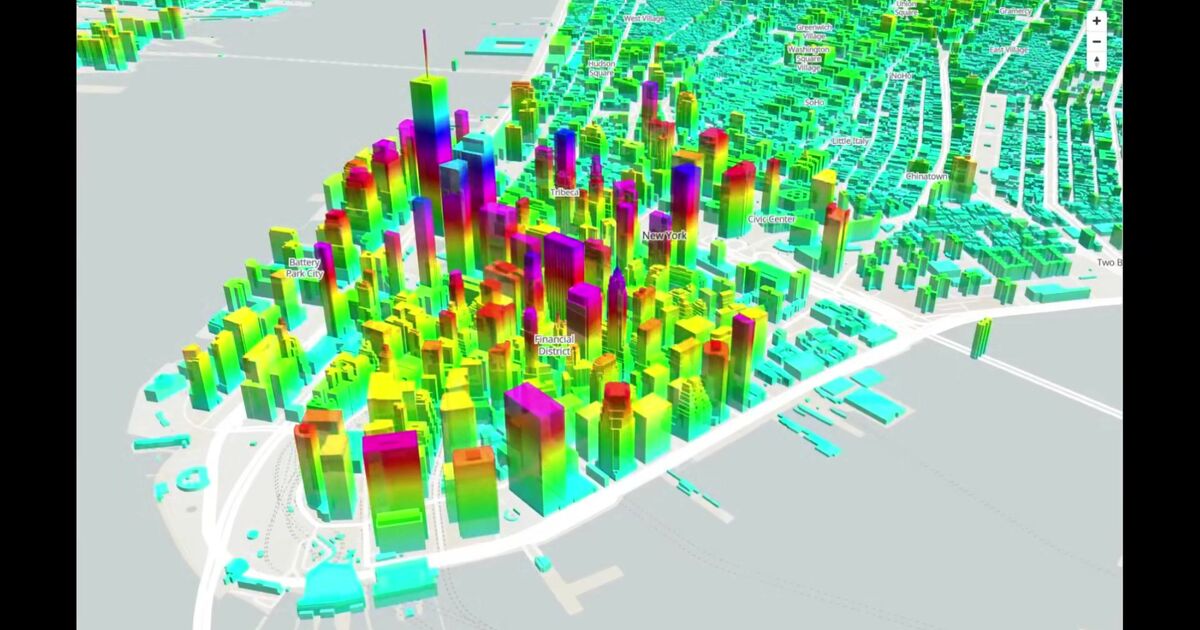
For Day 69, I built a small city experiment where building extrusions are colored using a rainbow gradient, so verticality is visible at a glance. Short buildings sit in warmer hues, taller ones shift toward cooler tones, and clusters begin to read like distinct skyline profiles.
The stack combines Three.js and MapLibre GL JS, with a GLSL mapping that translates elevation into hue. The key is keeping that transition smooth and continuous, otherwise the city reads as noise rather than structure.
There is also a performance layer behind a simple visual. Urban datasets can contain thousands of buildings, so batching geometry or relying on the map engine’s extrusion pipeline becomes important to maintain a stable frame rate.
It is a light experiment, but it highlights something useful: a well-chosen encoding can make 3D structure immediately readable.
Live demo: Rainbow Cities
The project
| Piece | Role |
|---|---|
| Stack | Three.js + MapLibre GL JS |
| Encoding | Elevation to hue via GLSL |
| Perf | Geometry batching / map extrusion pipeline |
| Point | Encoding makes vertical structure readable |
How to follow
- Blog: blog.maptheclouds.com
- LinkedIn: Day 69 post
- Live demo: Rainbow Cities
- Hashtag: #100DayMapChallenge
#100DayMapChallenge · Day 69/100 · LinkedIn
Previous: Day 68: Race Tracker
Next: Day 70: Cluj Folded Map