
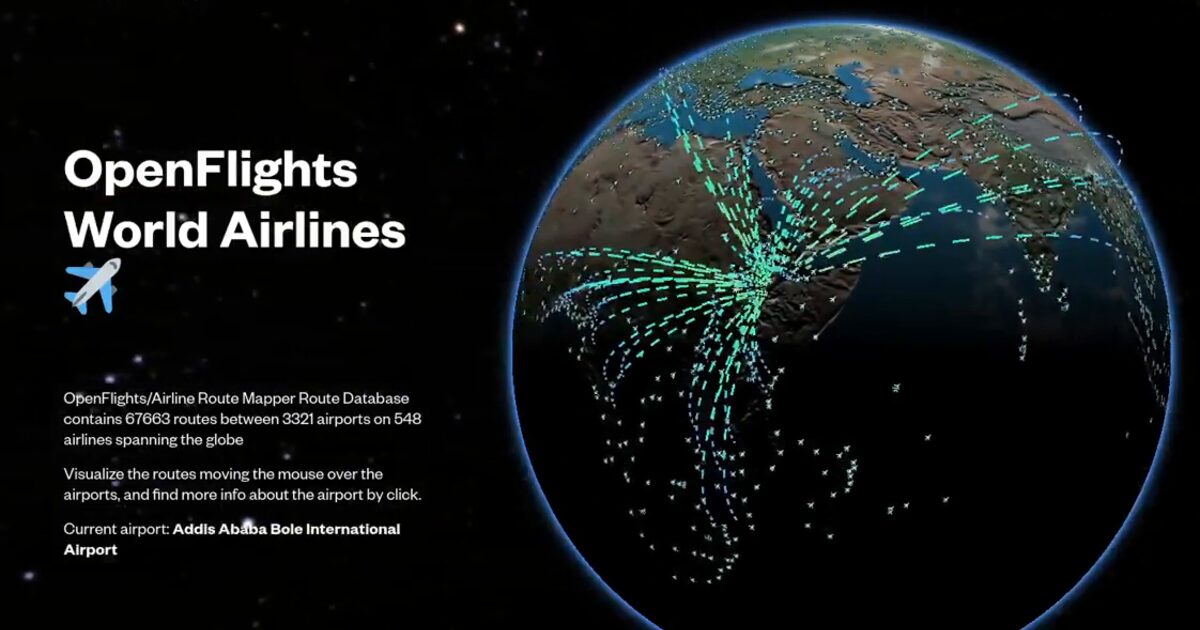
Day 65. OpenFlights World Airlines ✈️
What happens when 10,000+ transport nodes need to stay interactive on a rotating globe?
For Day 65, I built an interactive globe using the OpenFlights datasets, with 10,000+ points covering airports, train stations, and ferry terminals.
The project uses Three.js and WebGL, mapping point instances onto a textured Earth. The main challenge was balancing interactivity and performance, making sure every point remains queryable while rotation and zoom stay smooth. An instancing workflow, combined with optimized raycasting and distance-based visibility, keeps the frame rate stable even at scale.
A key interaction is the route layer: hovering an airport reveals animated connections, based on tens of thousands of routes. This shifts the globe from a static point cloud into a readable network.
What stands out is how clearly infrastructure patterns emerge. Europe and East Asia form dense clusters, while more remote regions reveal gaps in global connectivity.
Live demo: OpenFlights World Airlines
The project
| Piece | Role |
|---|---|
| Data | OpenFlights airports + routes |
| Perf | Instancing, optimized raycasting, distance visibility |
| UX | Hover airport reveals animated route layer |
| Read | Dense Europe/East Asia vs connectivity gaps |
How to follow
- Blog: blog.maptheclouds.com
- LinkedIn: Day 65 post
- Live demo: OpenFlights World Airlines
- Hashtag: #100DayMapChallenge
#100DayMapChallenge · Day 65/100 · LinkedIn
Previous: Day 64: Aiudului Gorges
Next: Day 66: Disco Earth