
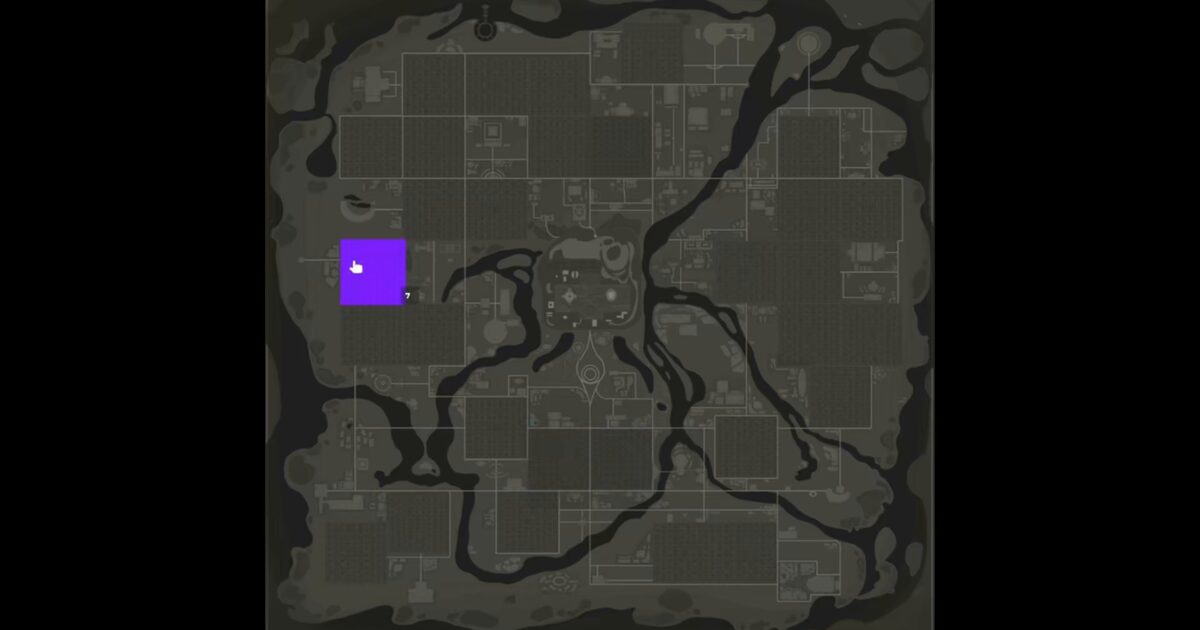
Day 46. Interactive virtual land map 🗺️
Some mapping problems start when real-world coordinates don’t exist.
This project involved building a two-level interactive map for a blockchain-based virtual land platform, where users move from a world overview into detailed plot grids with per-plot interaction. The system had to support property overlays, popups, and SOLD states, while staying responsive across devices.
The challenge was not just rendering the map, but defining a complete spatial system for a fictional world. I worked in QGIS using a custom coordinate system, then built the interface in D3.js with SVG-based interaction and zoom behaviour.
As users navigate, the experience shifts between scales: a small set of regions at the global level, and detailed plot-level interaction beneath. Keeping both levels aligned and predictable required careful control of projection, state, and navigation.
The result is a mapping interface that treats virtual land with the same spatial logic as real-world geography, while remaining flexible enough for digital assets and evolving datasets.
Delivered in under three weeks, the project received a 5-star review and remains one of the most interesting client-focused examples from this series.
Live demo: not public (client production).
The project
| Piece | Role |
|---|---|
| Client | Blockchain virtual land platform (confidential) |
| Stack | QGIS custom CRS + D3.js SVG + zoom |
| UX | World regions to plot grid; SOLD states; popups |
| Delivery | Under 3 weeks; 5-star Upwork review |
How to follow
- Blog: blog.maptheclouds.com
- LinkedIn: Day 46 post
- Live demo: not public (client production)
- Hashtag: #100DayMapChallenge
#100DayMapChallenge · Day 46/100 · LinkedIn
Previous: Day 45: Chlorophyll Ocean
Next: Day 47: Atmosphere