
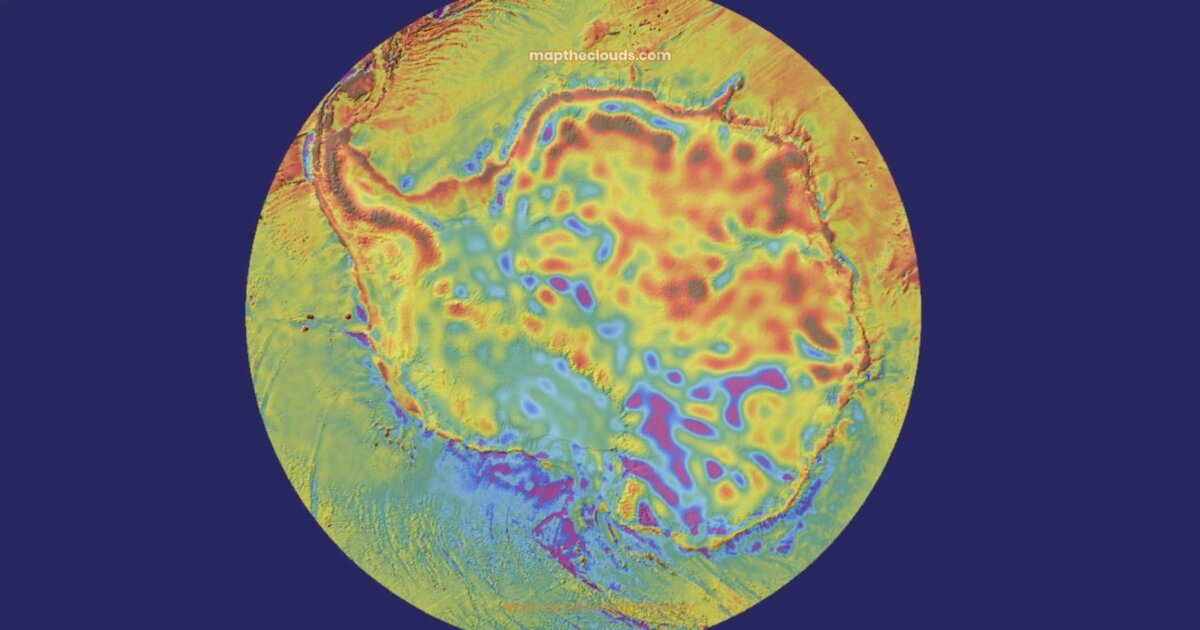
Day 38. Visualizing the invisible forces beneath Antarctica 🧊
What does gravity look like at Earth’s most remote continent? This 3D visualization maps gravity disturbances across Antarctica using the EIGEN-6C4 model at 0.1° resolution. The dataset comes from the Quantarctica project by the Norwegian Polar Institute, revealing subtle variations in the gravitational field caused by differences in ice thickness, bedrock density, and subglacial topography.
The data was processed in QGIS to prepare the spatial layers. Positive anomalies appear as elevated surfaces in warmer tones, while negative ones form depressions in cooler colors.
Rather than mapping what is visible on the surface, this visualization reveals the hidden forces shaping Antarctica from below. In this view, the continent becomes readable not through its ice sheet, but through the gravitational signatures of the landscape beneath it.
Live demo: Antarctica gravity
The project
| Piece | Role |
|---|---|
| Model | EIGEN-6C4, 0.1° resolution |
| Source | Quantarctica / Norwegian Polar Institute |
| Prep | QGIS spatial layers |
| Render | Three.js: warm highs / cool lows |
How to follow
- Blog: blog.maptheclouds.com
- LinkedIn: Day 38 post
- Live demo: Antarctica gravity
- Hashtag: #100DayMapChallenge
#100DayMapChallenge · Day 38/100 · LinkedIn
Previous: Day 37: Populated Places