
Day 26. Breaking down a nation 🇷🇴
How do you show the administrative structure of an entire country in a single view?
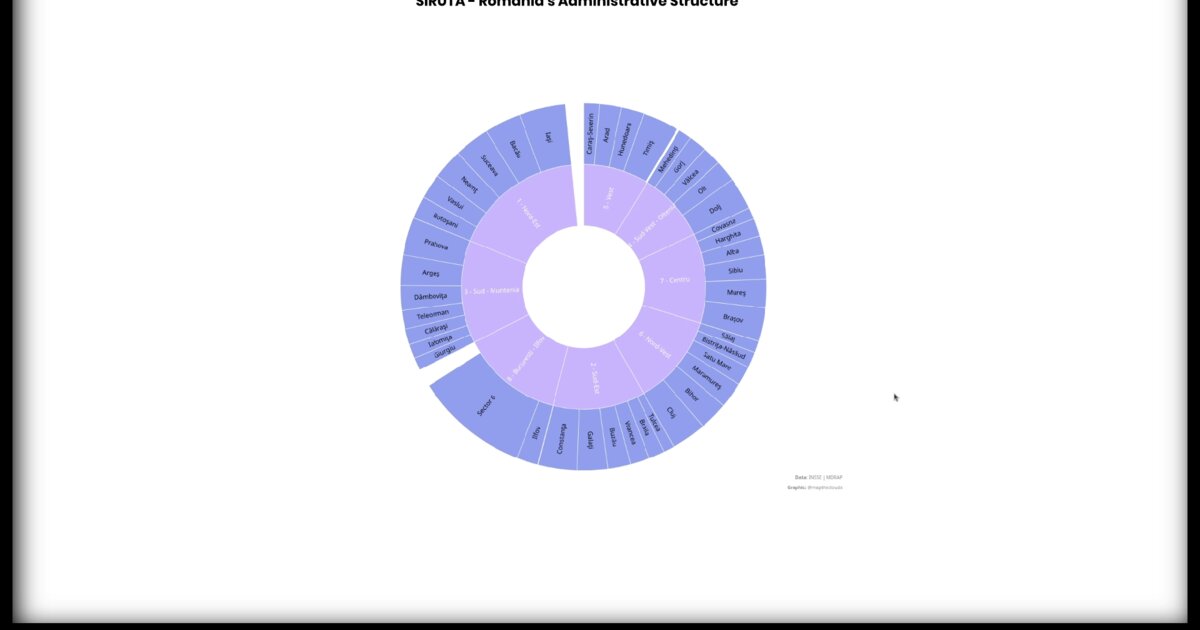
This visualization is based on SIRUTA, Romania’s system for administrative units. It descends from regions to counties, then through administrative ranks and codes, from largest cities to smallest villages.
I used a zoomable sunburst diagram. Area represents population. The hierarchy unfolds radially from center outward. Click a segment to reveal more detail. Click the center to collapse back up.
A sunburst works when a system is deeply hierarchical and each level subdivides further. Each ring represents a deeper level, while each segment remains proportional to its value. The structure becomes readable at a glance, but also explorable in depth.
Technically, the visualization uses D3.js partition layout with smooth zoom transitions. The main challenge was balancing scale and legibility: thousands of administrative units in limited screen space. The solution was progressive disclosure, starting with overview and revealing detail only when requested.
When structure is nested and scale varies, radial layouts help reveal both.
Live demo: SIRUTA part-to-whole sunburst
The project
| Piece | Role |
|---|---|
| Data | SIRUTA administrative units |
| Layout | D3 partition / zoomable sunburst |
| Encoding | Area ≈ population |
| UX | Progressive disclosure for scale |
How to follow
- Blog: blog.maptheclouds.com
- LinkedIn: Day 26 post
- Live demo: SIRUTA part-to-whole sunburst
- Previous: Day 25: COVID Geographic Clusters
- Hashtag: #100DayMapChallenge
#100DayMapChallenge · Day 26/100 · LinkedIn
Previous: Day 25: COVID Geographic Clusters