
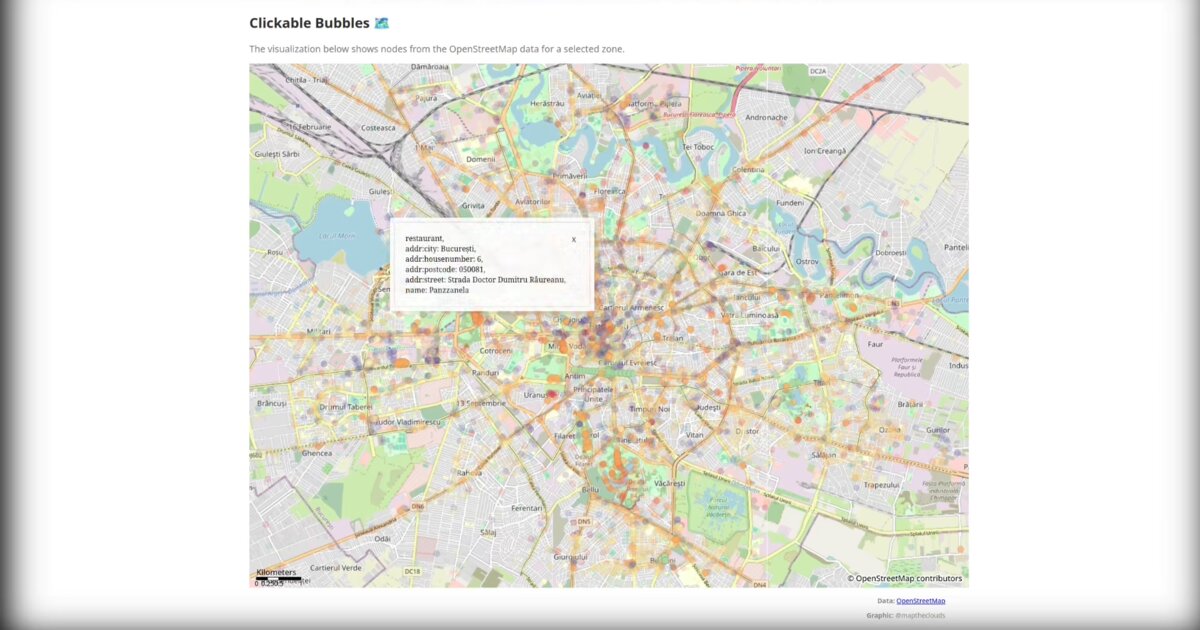
Day 18/100: Clickable Bubbles 🗺️
The visualization shows nodes from OpenStreetMap data for a selected zone. Each bubble represents a geographic feature: parks, amenities, buildings, landmarks. Size reflects importance or area, color shows category. Interaction is the key layer. Click reveals metadata. Pan and zoom explore regions. Filters isolate categories.
OSM isn’t just geometry. Each node carries tags, names, hours, accessibility data, and community knowledge. This visualization surfaces that richness using the Overpass API to query and retrieve the data dynamically.
This project reinforced how collaborative mapping builds a global knowledge graph, not just a map. Every node is contributed knowledge. Every tag is human-verified information. 🌍
When you visualize OSM, you’re not just showing places: you’re showing collective intelligence.
Live demo: OpenStreetMap bubbles
Data sources: OpenStreetMap
Inspiration: overpass-turbo.eu Overpass API examples and documentation
The project
| Piece | Role |
|---|---|
| Overpass API | Query OSM nodes for a zone |
| Bubbles | Size ≈ importance/area; color ≈ category |
| Click / pan / zoom / filter | Metadata and exploration |
| D3.js | Interactive rendering |
OSM tags (name, hours, accessibility, amenity types) are the payload. Geometry alone would miss the point.
Note from campaign draft (optional depth)
An earlier draft called out viewport-based drawing and spatial indexing for smooth pan with thousands of elements. Worth keeping in mind if you revisit performance on this demo (status note in mapping: fix pan, add search).
How to follow
- Blog: blog.maptheclouds.com
- LinkedIn: Day 18 post
- Live demo: openstreetmap playground
- Previous: Day 17 – Map scales
- Hashtag: #100DayMapChallenge
#100DayMapChallenge · Day 18/100 · Clickable OSM bubbles · LinkedIn
Previous: Day 17: Every Map Lies About Scale