
Day 10: Why hexagons for population density 🔶
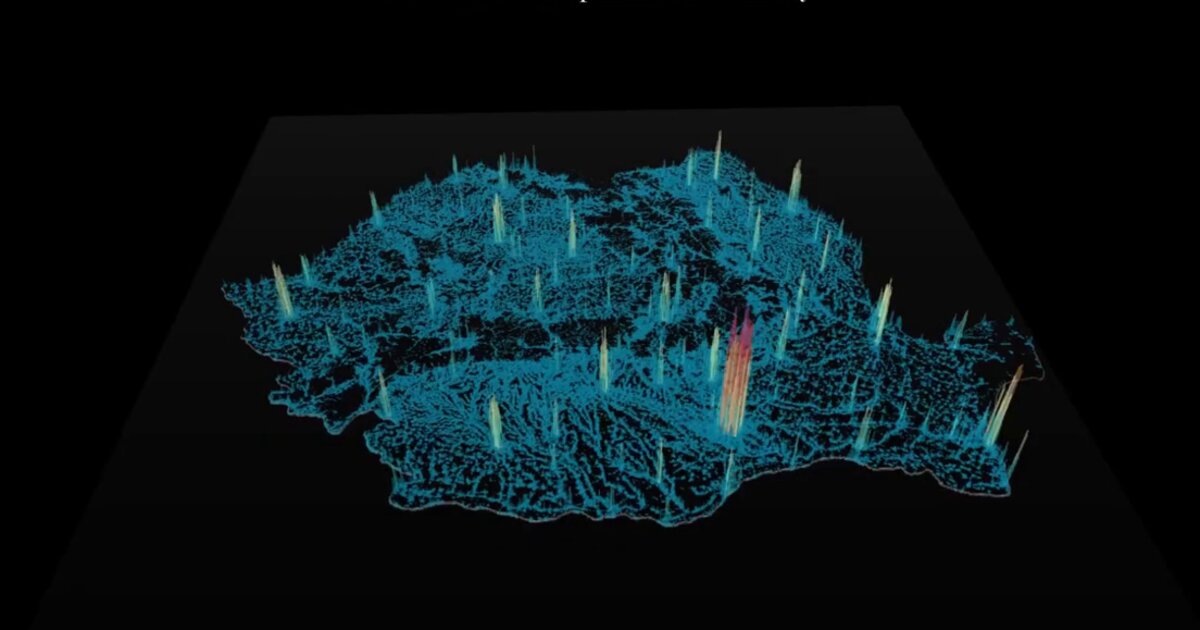
Administrative boundaries rarely reflect how people actually occupy space. Counties and cities draw neat boxes, but settlement patterns are continuous and uneven. To explore this, I used Uber’s H3 hierarchical hexagonal index to visualize Romania’s population density at 400-meter resolution, where each hexagon represents the number of people living within it.
Hexagons offer advantages over squares or triangles. Each cell touches six neighbors at equal distance, minimizing directional bias. They reduce edge effects and approximate circular distance relationships while still tessellating perfectly. 📐
The workflow combined QGIS for H3 grid processing and Qgis2threejs to export a 3D web visualization. The result is a browser scene of semitransparent hexagonal columns, where height and color both encode density. Urban peaks emerge immediately, without relying on administrative borders. 🏔️
H3 also supports hierarchical aggregation, allowing smooth zooming from neighborhood to national scale while preserving spatial relationships. That matters when analyzing patterns that ignore political boundaries.
Live demo: Romania hex population · Video: YouTube
The project
Day 8 mapped built-up footprint beyond Cluj’s admin line. Day 10 asks the same kind of question at national scale: where do people actually live, if we ignore county boxes?
Grid: Uber H3, ~400 m cells. Value per cell: number of people. Release note in the project mapping: 2022-06-30. Visualization: semitransparent hexagonal columns in the browser, height and color both carrying density.
Why hexagons
| Property | Why it helps density maps |
|---|---|
| Six equal neighbors | Less directional bias than squares |
| Near-circular distance | Better approximation of equal reach |
| Perfect tessellation | Full coverage without gaps |
| H3 hierarchy | Aggregate up/down resolution while keeping lineage |
Squares are simpler to store. Hexes are often fairer for neighborhood relationships on a continuous surface.
Workflow
| Step | Tool |
|---|---|
| Build / join H3 population grid | QGIS |
| Export interactive 3D scene | Qgis2threejs |
| Explore urban peaks vs sparse cells | Browser (Three.js under the hood) |
No choropleth of județe. The peaks are where the people are.
Why this day matters in the series
Week 2 keeps pushing interactivity and spatial honesty: settlement from orbit (Day 8), perception on Gravity Hill (Day 9), then density without political polygons (Day 10). H3 is the technical hinge for later hierarchical and 3D cartography work.
How to follow
- Blog: blog.maptheclouds.com
- LinkedIn: Day 10 post
- Live demo: romania-hex
- Previous: Day 9 – Gravity Hill
- Hashtag: #100DayMapChallenge
#100DayMapChallenge · Day 10/100 · Romania H3 population · LinkedIn
Previous: Day 9: A Ball That Rolls Uphill