
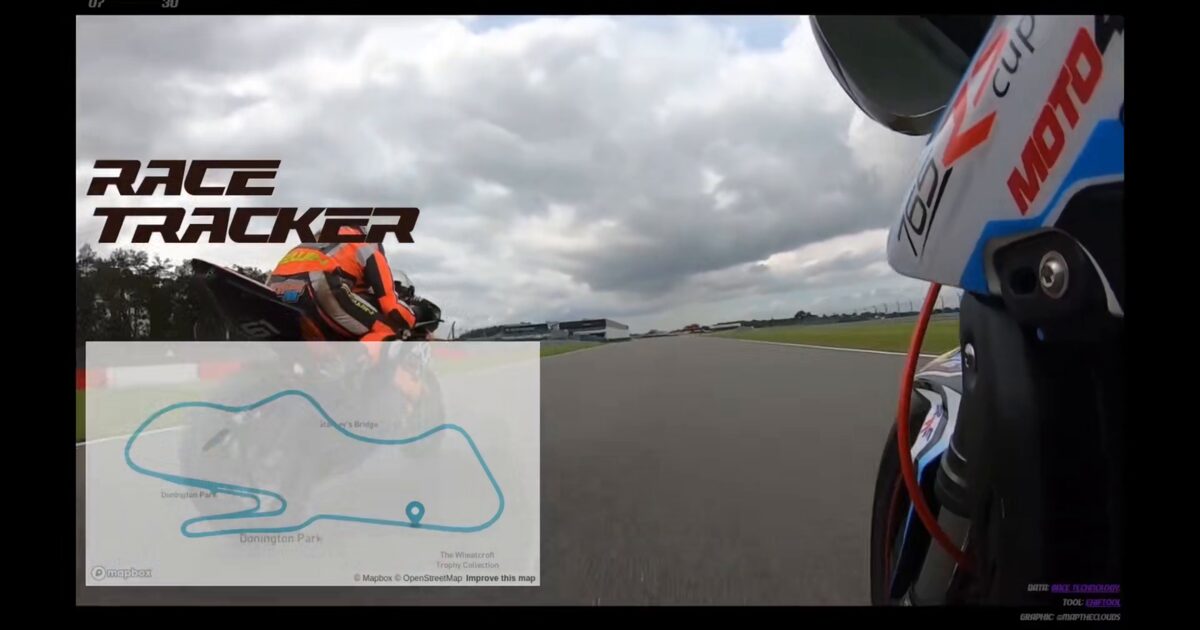
Day 68. Race Tracker 🏍️
A route shows where you went. Timing shows what actually happened.
For Day 68, I built a small race replay that synchronizes three streams: GPS position, telemetry, and video playback. The map shows the track line, a marker moves in real time, and telemetry values update alongside the footage, turning a simple path into something closer to a timed narrative.
The build uses Mapbox GL JS for the map, with a data pipeline that starts from GoPro GPS metadata extracted using ExifTool. The core challenge is time alignment, since GPS, telemetry, and video all run at different sampling rates and timestamps. To keep the replay smooth, position is interpolated and playback time is mapped consistently to the correct telemetry frame.
This is a small build, but a useful one. It shows how maps become more engaging when they are tied to events, not just coordinates.
Live demo: Race Tracker
The project
| Piece | Role |
|---|---|
| Map | Mapbox GL JS track + moving marker |
| Pipeline | GoPro GPS via ExifTool |
| Challenge | Align GPS, telemetry, and video sampling rates |
| Result | Timed narrative, not just a path |
How to follow
- Blog: blog.maptheclouds.com
- LinkedIn: Day 68 post
- Live demo: Race Tracker
- Hashtag: #100DayMapChallenge
#100DayMapChallenge · Day 68/100 · LinkedIn
Previous: Day 67: Power Grid SLD
Next: Day 69: Rainbow Cities