
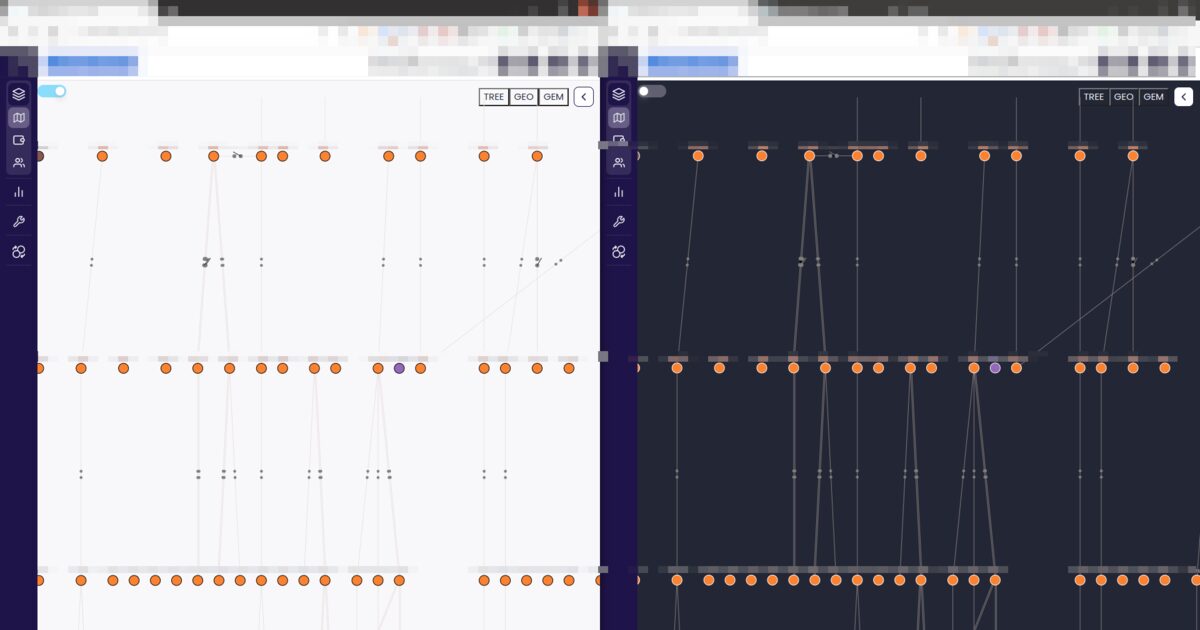
Day 67. Power Grid SLD ⚡
Some of the most meaningful visualization work does not get published, but it quietly supports real decisions every day.
For Day 67, I am sharing a client project where I built an interactive Single Line Diagram from scratch for a utility software platform. The component visualizes substation topology across multiple voltage levels and is designed for real engineering workflows, not just presentation.
An SLD has to remain readable under pressure, especially when users switch context quickly. In this case, the graph handles 600+ nodes, voltage-based filtering, and transitions between Tree hierarchy and geospatial layout without losing orientation.
The stack combines D3.js v7, React, TypeScript, and Mapbox GL JS, connected to a live REST API with authenticated topology updates. The implementation also includes sticky HTML popups, collision handling for overlapping assets, and coordinated state across layout modes, filters, and map navigation.
The project itself is not public, but it remains one of the clearest examples in my work of applied network visualization, where clarity, performance, and usability all have to hold together.
Live demo: not public (client production dashboard).
The project
| Piece | Role |
|---|---|
| Client | Utility software platform (confidential) |
| Stack | D3.js v7 + React + TypeScript + Mapbox GL JS |
| Scale | 600+ nodes; voltage filters; Tree vs geospatial |
| UX | Sticky HTML popups, collision handling, live REST API |
How to follow
- Blog: blog.maptheclouds.com
- LinkedIn: Day 67 post
- Live demo: not public (client production dashboard)
- Hashtag: #100DayMapChallenge
#100DayMapChallenge · Day 67/100 · LinkedIn
Previous: Day 66: Disco Earth
Next: Day 68: Race Tracker