
Day 42. Rivers as flow networks 🌊
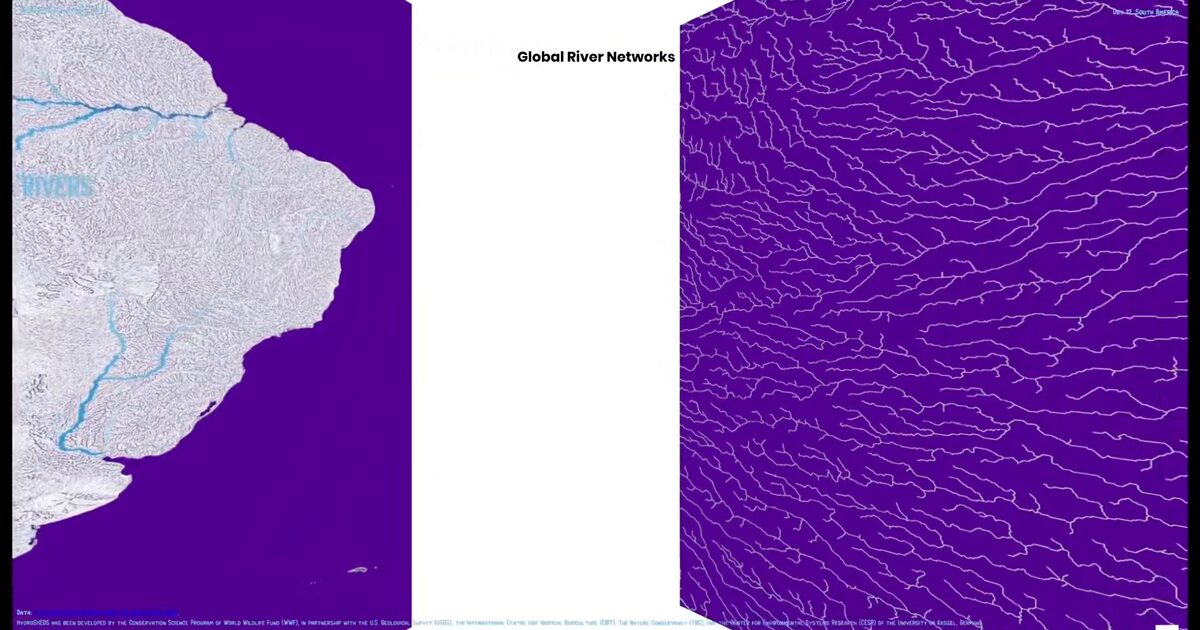
South America’s river systems visualized as interconnected flow networks.
The project uses the HydroSHEDS river dataset (15s resolution, 2006), developed by the WWF Conservation Science Program in collaboration with USGS, CIAT, The Nature Conservancy, and the University of Kassel. The dataset captures the hierarchical structure of river systems across the continent.
Instead of presenting the network as a single static map, the visualization exports the river system at multiple zoom levels. These views are arranged in a rotating carousel built with Three.js, allowing users to move through different scales of the same network and pause wherever they want to explore the structure.
River systems are inherently hierarchical. Small streams converge into tributaries, tributaries merge into major rivers, and those rivers eventually reach the ocean. Viewing these patterns across several scales reveals both the continental structure and the local complexity.
The main challenge was preparing clean exports at multiple resolutions and creating smooth transitions between them inside the Three.js carousel. The goal was to let viewers move between macro and micro perspectives without losing context.
Live demo: SA Rivers
The project
| Piece | Role |
|---|---|
| Data | HydroSHEDS 15s river network (WWF/USGS) |
| Prep | QGIS multi-resolution exports |
| UX | Three.js rotating carousel, pause to explore |
| Theme | Hierarchical flow from streams to main rivers |
How to follow
- Blog: blog.maptheclouds.com
- LinkedIn: Day 42 post
- Live demo: SA Rivers
- Hashtag: #100DayMapChallenge
#100DayMapChallenge · Day 42/100 · LinkedIn
Previous: Day 41: Africa 3D Globe