This is a tutorial about deriving 3D hexagons from an elevation model in QGIS and visualizing them in Threejs using Qgis2threejs.
During the #30DayMapChallenge 2021 on Twitter, when I was preparing the map for day 5, Hexagons, I wanted to create a 3D hexagonal map of ‘The Nose’ zone from Yosemite Valley. The map would have displayed a 3D hexagonal grid, so I had to create the mini-hexagons.
Because I kept repeating the process, I needed a way to remember the steps. Therefore, I started documenting the process in several short tweets. 🙂
You can obtain similar results using only the QGIS 3D renderer, and Klas Karlsson has made a video tutorial about this method, that can be found on YouTube.
Here’s my process, so that I(you) don’t have to repeat it a thousand times to succeed. 😀
3D hexagons in QGIS – making of
1. Create a raster in the shape of a hexagon
Firstly, I draw a hexagon big enough to cover the chosen area, by creating a hexagonal grid and keeping a single polygon.
An alternative would be to create a new polygon layer and drawing a polygon with the help of a plugin.
Vector->Research Tools->Create Grid->Hexagon(Polygon)I use this hexagon to clip the part of the raster that intersects it, using a layer mask.
Raster->Extraction->Clip raster by mask layer


2. Create a hexagonal grid and update with raster values
I create a hexagonal grid with the horizontal and vertical spacing of 50m, using the extent from the clipped portion from the raster.
Vector->Research Tools->Create Grid->Hexagon(Polygon)Then, I transfer the medium height value from the raster pixels to the resulting polygons, using Zonal statistics.
Processing Toolbox->Raster Analysis->Zonal statistics


Now we have a grid of hexagons that contain mean elevation values.
We could use this layer to draw the 3D map. But we would end up with an enormous 3D model because we have used the absolute elevation values.
Because we need only the relative height, we have to subtract the minimum height value. So, I create a new ‘rel_height’ field and update it with the minimum height value. You can find the minimum height by double-clicking on the clipped elevation layer and go to Information, STATISTICS_MINIMUM, by sorting the grid values or by calculating the statistics for the column.
Then, I filter the grid to exclude the polygons without values using right click on the layer and Filter. Finally, I export the resulting polygons.


3. Transform from vector to raster
In order to display the hexagons in Three.js, we have to transform the polygon layer into a raster layer.
For the third step, I convert the filtered layer from vector to raster.
Processing Toolbox->GDAL->Vector conversion->Rasterize(vector to raster)I use the following parameters:
- burn-in value: ‘rel_height’
- horizontal and vertical resolution: 0.5
- output units: ‘Georeferenced units’
- extent: the filtered layer
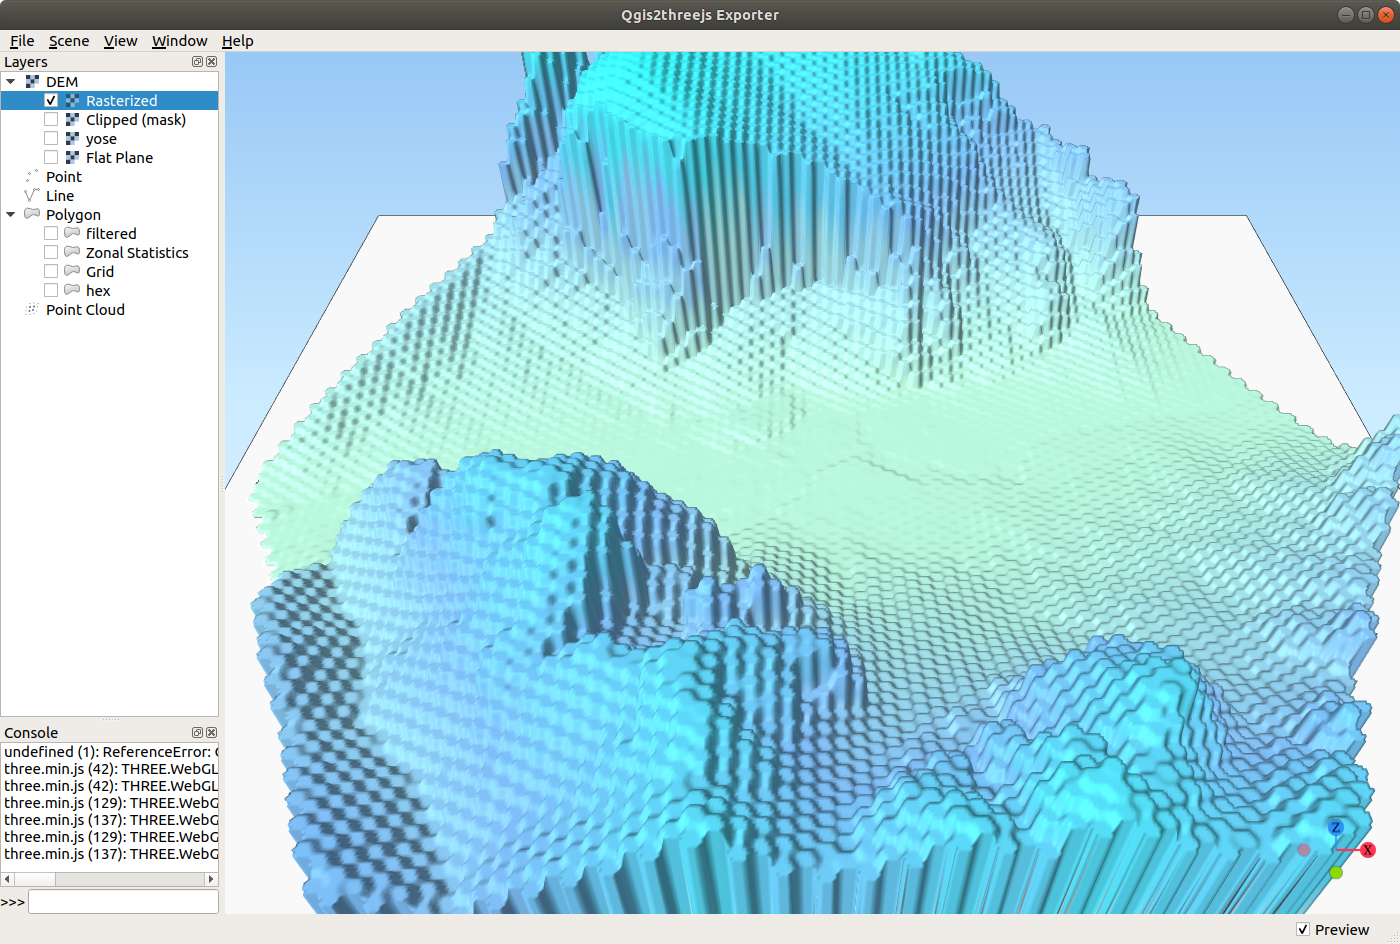
After that, I choose a turquoise color ramp as style for the resulting image, to better examine it.


4. Explore the scene in the Qgis2threejs window
You are now able to explore the scene in Three.js by clicking in the page menu. The plugin will open a new window containing the 3D visualizer.
Web->Qgis2threejsQgis2threejs allows us to select which layers can be displayed, each layer properties, and prepare the 3D environment for exporting to web.
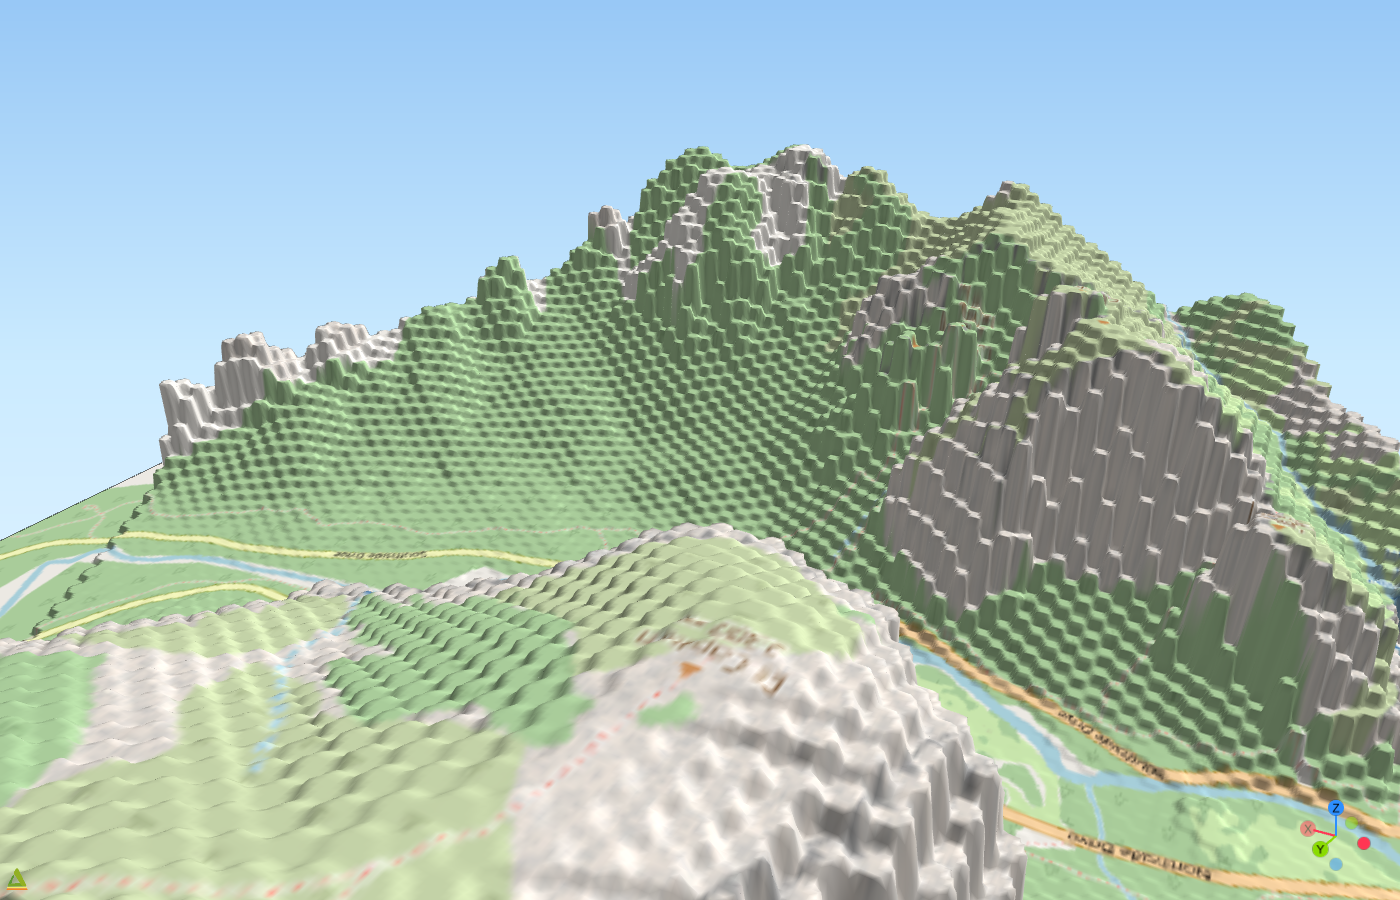
In addition, I can increase the resampling level and add edges to highlight the hexagons.


Because I want to use a more familiar map style, I add to QGIS a new raster tiles layer from OpenStreetMap. After that, I set the general opacity to 0 to allow Qgis2threejs borrow the background colors.
5. Export the scene to Three.js for the web
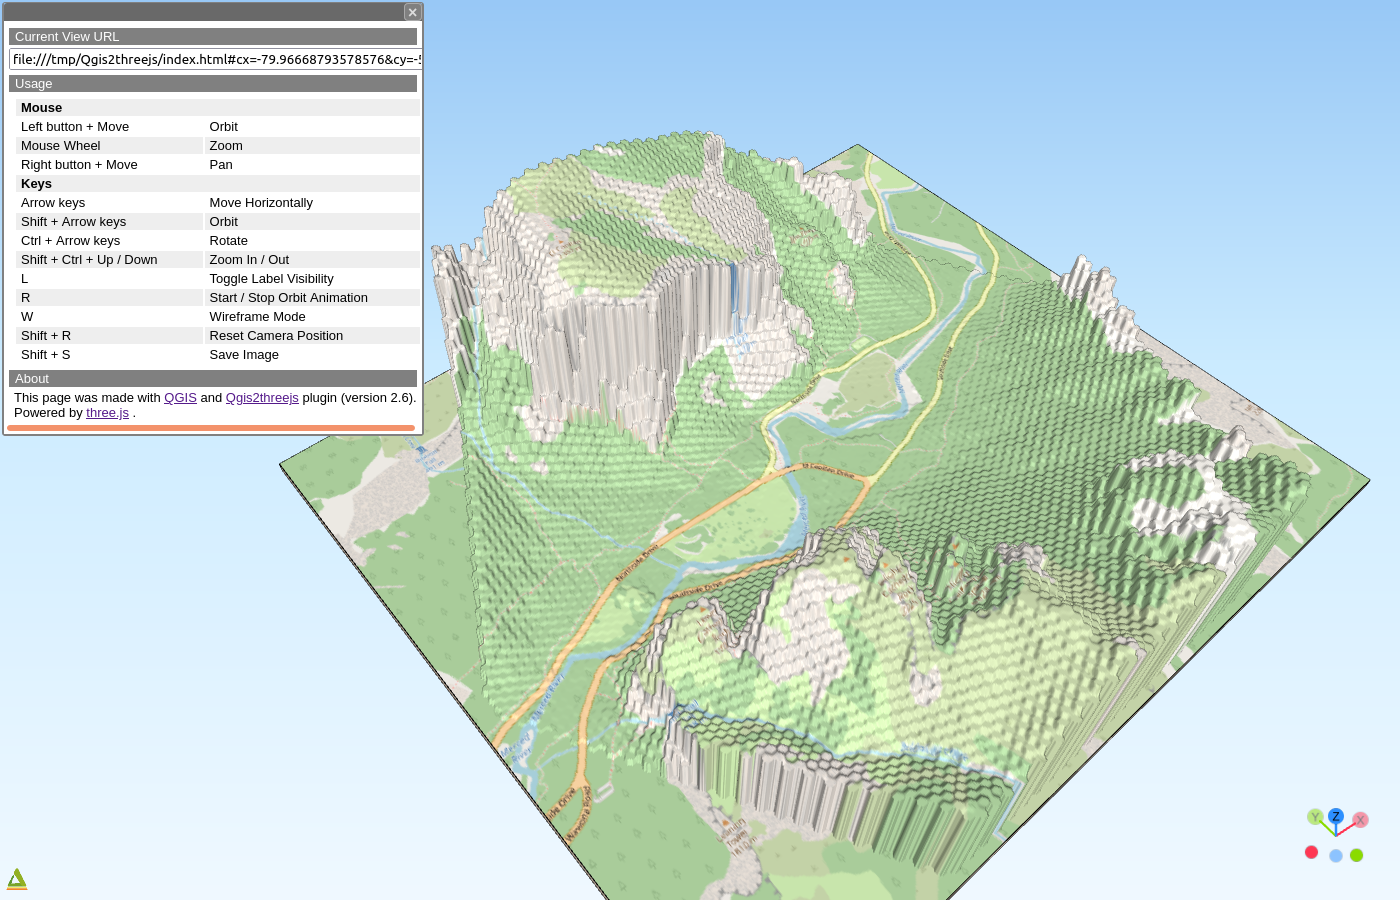
The final step in the process of creating and visualizing 3D hexagons in QGIS is to export the scene to web with the option ‘Enable the viewer to run locally’ checked.
You can now inspect the result in the browser, or integrate the code in another page.


To conclude, I must admit there are many steps to get from an elevation model to a 3D hexagonal model in Three.js. But the result is a very interesting visualization.
I must try other visualizations, too, using this fantastic plugin, Qgis2threejs, and other alternatives to obtain the 3D hexagons (homework !).
That being said, this was the making of tutorial for The Hexagonal Nose ⬡⬡⬡