Here’s a story about my #30DayMapChallenge 2021.
I have a special talent of delaying my favorite projects. I love making maps, and during all those years at work I have digitized miles and miles of roads, solved thousands of bugs, and said to myself a million times: ‘I will start making personal projects, I will draw my favourite maps in D3.js’ .. Without success, obviously. 🙂
But when #30DayMapChallenge was born on Twitter two years ago (it’s Topi Tjukanov‘s child), it was like a spark that started teasing me more and more. Eventually I’ve forced myself to draw 30 maps for all those years of delaying, in only 30 days.
November has become my ‘map as you can when you can‘ month, when thousands of people who love maps share their works and knowledge, and I struggle to catch up with them. 😀
#30DayMapChallenge on Twitter
Description:
Create a map each day of the month and publish it on Twitter using the hashtag #30DayMapChallenge.
Themes: here and here are the themes for November 2021.
Data sources:
https://github.com/tjukanovt/30DayMapChallenge#data-
https://github.com/z3tt/30DayChartChallenge_Collection2021
Tools:
https://github.com/tjukanovt/30DayMapChallenge#tools-
My #30DayMapChallenge 2021
Or ‘how I survived #30DayMapChallenge‘!
I’ve been watching the challenge since the beginning, I have even contributed with two or three maps the last years, but this last December I managed to finish all the maps. So I can say I have survived #30DayMapChallenge!
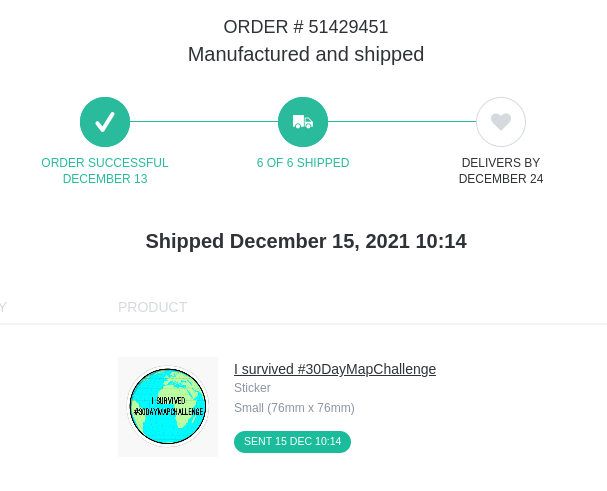
Like this sticker below would have proven, if the parcel would have arrived until now.. 🙂
It was exhausting and I don’t think I’ll do it again. 😀
I haven’t prepared any data or planned any map before the challenge has started, and it was hard to make a map each day. Trying to keep it simple was the hardest thing to do, especially when I started to investigate new map tools like Blender and Three.js. So I ended up with a several days long delay, but I have managed to catch up with a few sleepless nights. 🥴😴
But I have learned a lot of things about 3D and interactive maps, and even about QGIS (I’ve used it seldom since now). And I have seen some amazing works from people all over the world, found out about new styling and mapping techniques, and new data sources.
You can find some of the collections in the tweets marked #30DayMapChallenge 2021 collections that I have setup to run daily on the DatavizRomania page on Twitter.
Metamapping
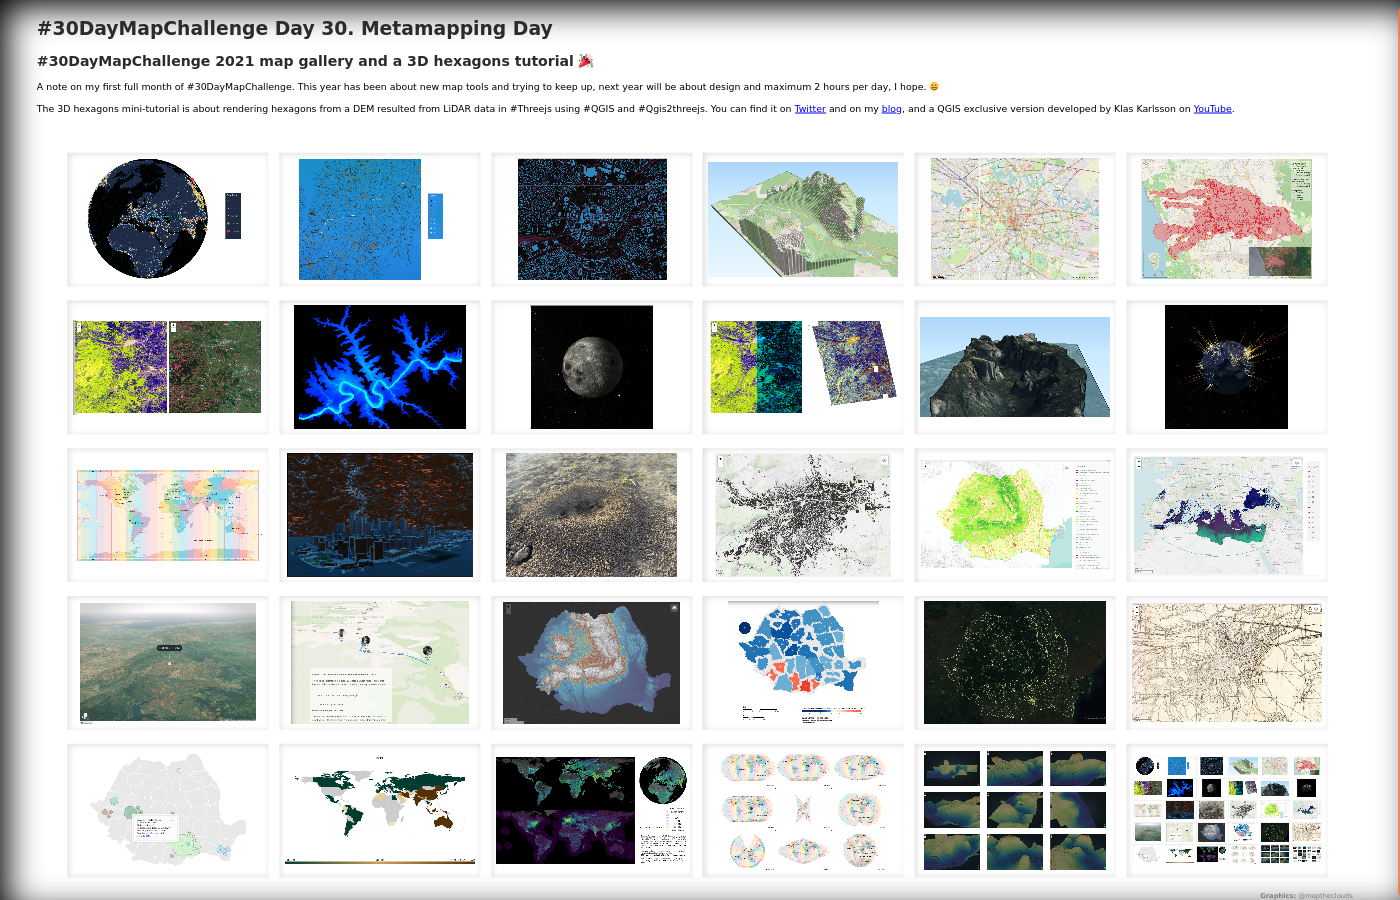
Those are my 29 maps + one metamapping gallery. During this year (I hope), I will talk briefly about each one of them on this blog. Here is the link to my tweets collection for #30DayMapChallenge 2021.
In a following article, I plan to talk about my favourite maps from the #30DayMapChallenge in 2021, too. ❤️
See you at #30DayMapChallenge 2022! (I know I’ve said I won’t do it again, but another talent of mine is that I also have a short memory 😀).
Until next time, I leave you with a map in Blender that took the most time to create, especially when animating the clouds.. ☁️