#30DayMapChallenge Day 1. Points
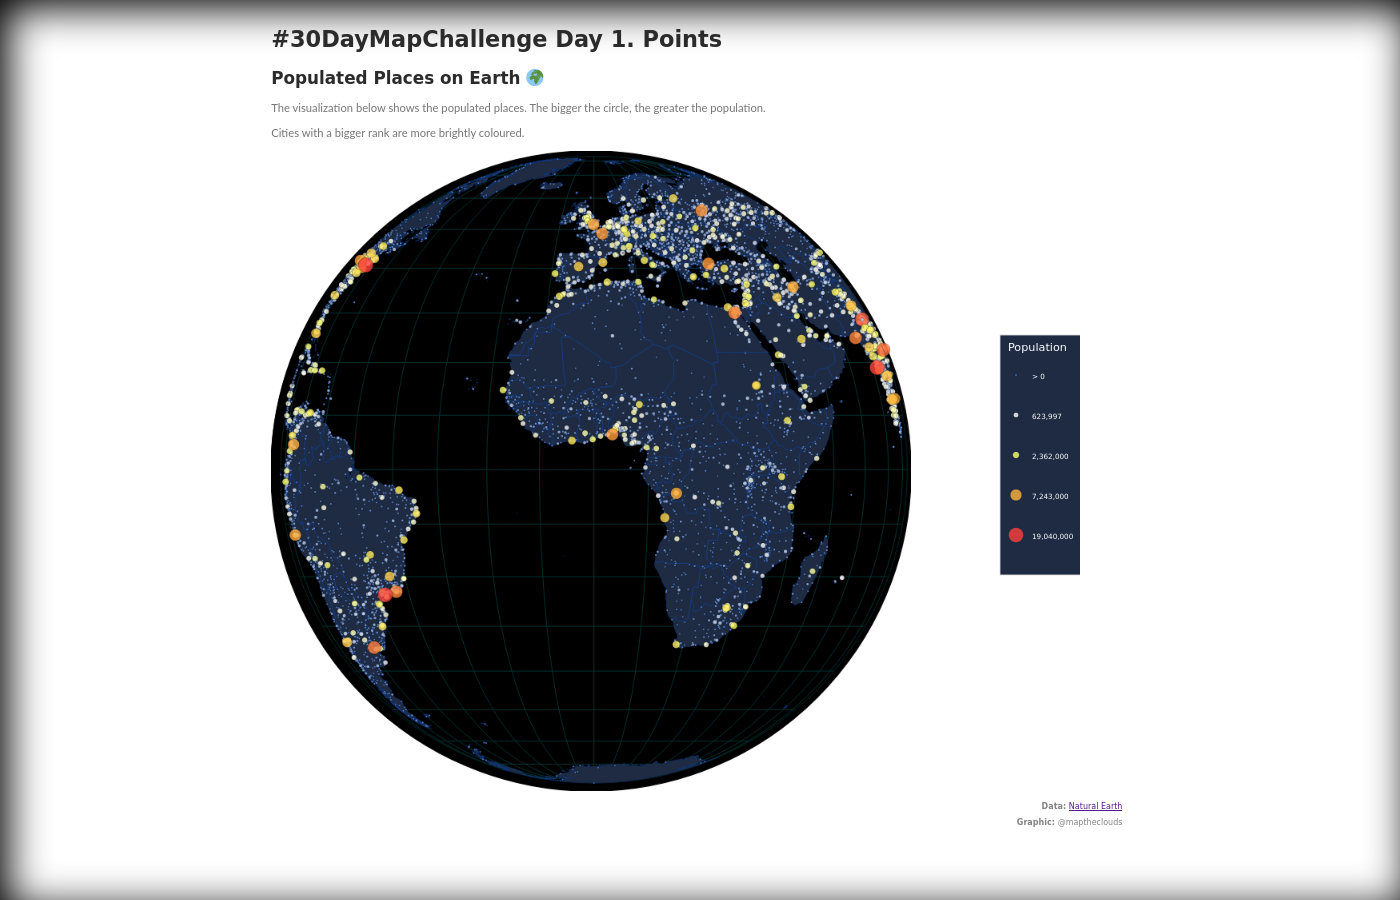
Populated Places on Earth 🌍
This is a 3D globe map in D3.js and Canvas, that I have made for the #30DayMapChallenge on Twitter in 2021. You can find out more about the challenge and my other maps in this post.
Goal: A map with points.
Solution: Display cities on a globe map.
Live: https://maptheclouds.com/playground/30-day-map-challenge/points/
Tweet: https://twitter.com/maptheclouds/status/1455203199716143121
Code: https://github.com/alexaac/map-challenges/tree/master/points
Description:
The visualization shows the most populated places on Earth. The bigger the circle, the greater the population.
Cities with a bigger rank are more brightly coloured.
Data: Natural Earth
Tags: #D3js #QGIS #mapshaper #canvas #interaction #globe #earth
Inspiration:
https://stackoverflow.com/questions/15907171/d3-canvas-globe-mouse-events
https://observablehq.com/@alainro/can-quadtree-speed-up-zoom-of-many-points-on-a-canvas
3D globe map in D3.js and Canvas – making of

Challenges: For the 3D globe map in D3.js and Canvas, I have downloaded the countries and cities from Natural Earth, because it was one of the free data sources for the challenge. First, I have explored it in QGIS, then I started mapping it on a globe using D3.js
The user can interact with the map by zooming, panning and clicking the cities, however, if you click at a smaller zoom you might not see the city so well. To improve the user interaction, I have set the map to rotate and center on the selected city.
The biggest challenge was to visualize many points on the globe and keep the interaction fast enough at the same time. In order to address this, I have chosen to draw the points using Canvas instead of loading the data as D3.js selections in the DOM.
// Draw the cities
  citiesData.features.forEach((city) => {
    context.beginPath();

    cityPath(city);

    context.lineWidth = 0.5 / (transform.k < 1 ? 1 : transform.k);
    context.strokeStyle = '#000';
    context.stroke();

    context.fillStyle = colorScale(city.properties.pop_max);
    context.fill();
  });
The issue with canvas is that you can’t interact directly with the points anymore, so I had to do a reverse search based on the mouse click to find the nearest point and display a label for it.
/* Get coordinates at mouse click, transform them into
     geographic coordinates and search nearest cities */
  function mapClick() {
    // Can't apply transformations unless scale 1
    if (transform.k !== 1) return;

    var mousePos = d3.mouse(this);
    var p = projection.invert(mousePos);

    if (p == undefined || !p[0] || !p[1]) {
      return false;
    }

    const city = findCityAtMapClick(mousePos, width, height, renderArgs);

    if (city) {
      selected = city;

      // Mutates projection - TODO try to use pure functions
      transition(city.geometry.coordinates, renderArgs);
    }
  }
Another solution that helped was to use d3.quadtree to speed up the search.
  const tree = d3
    .quadtree()
    .extent([
      [-1, -1],
      [width + 1, height + 1],
    ])
    .x((d) => d.geometry.coordinates[0])
    .y((d) => d.geometry.coordinates[1])
    .addAll(citiesData.features);

  const found = search(projection, tree, mousePos);
TODO:
It would be nice to better refine the search, so that the city is being picked more accurate on mouse click, and make the globe spin on left click, but I will leave those improvements for another challenge. 🙂
To conclude, I must say I have enjoyed making this map and I have learned more about globe maps in D3.js and Canvas interactions in general.