#30DayMapChallenge Day 8. Blue
Blue scale 🔷

In this post, I’ll talk a bit about styling elevation models in QGIS, giving as an example one of the maps I have made for the #30DayMapChallenge on Twitter in 2021. You can find out more about the challenge and my other maps in this post.
Goal: A map with blue colour or a map about something blue.
Live: https://maptheclouds.com/playground/30-day-map-challenge/blue/
Tweet: https://twitter.com/maptheclouds/status/1459176348065402894
Code: https://github.com/alexaac/map-challenges/tree/master/blue
Description:
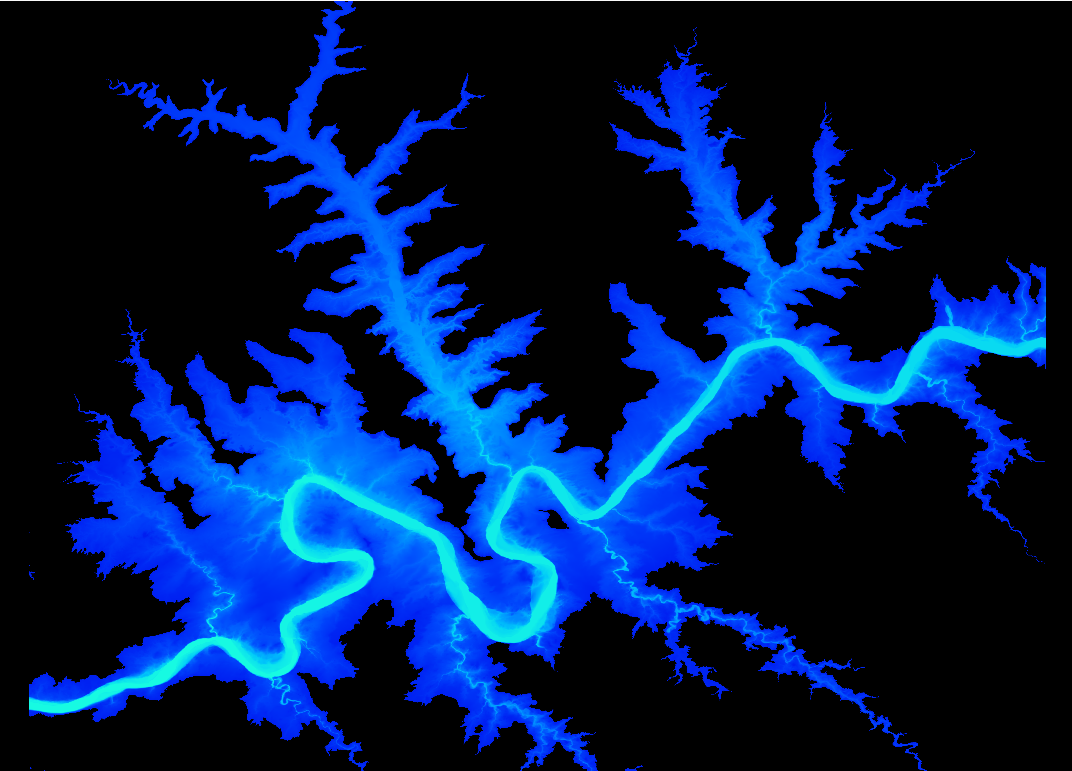
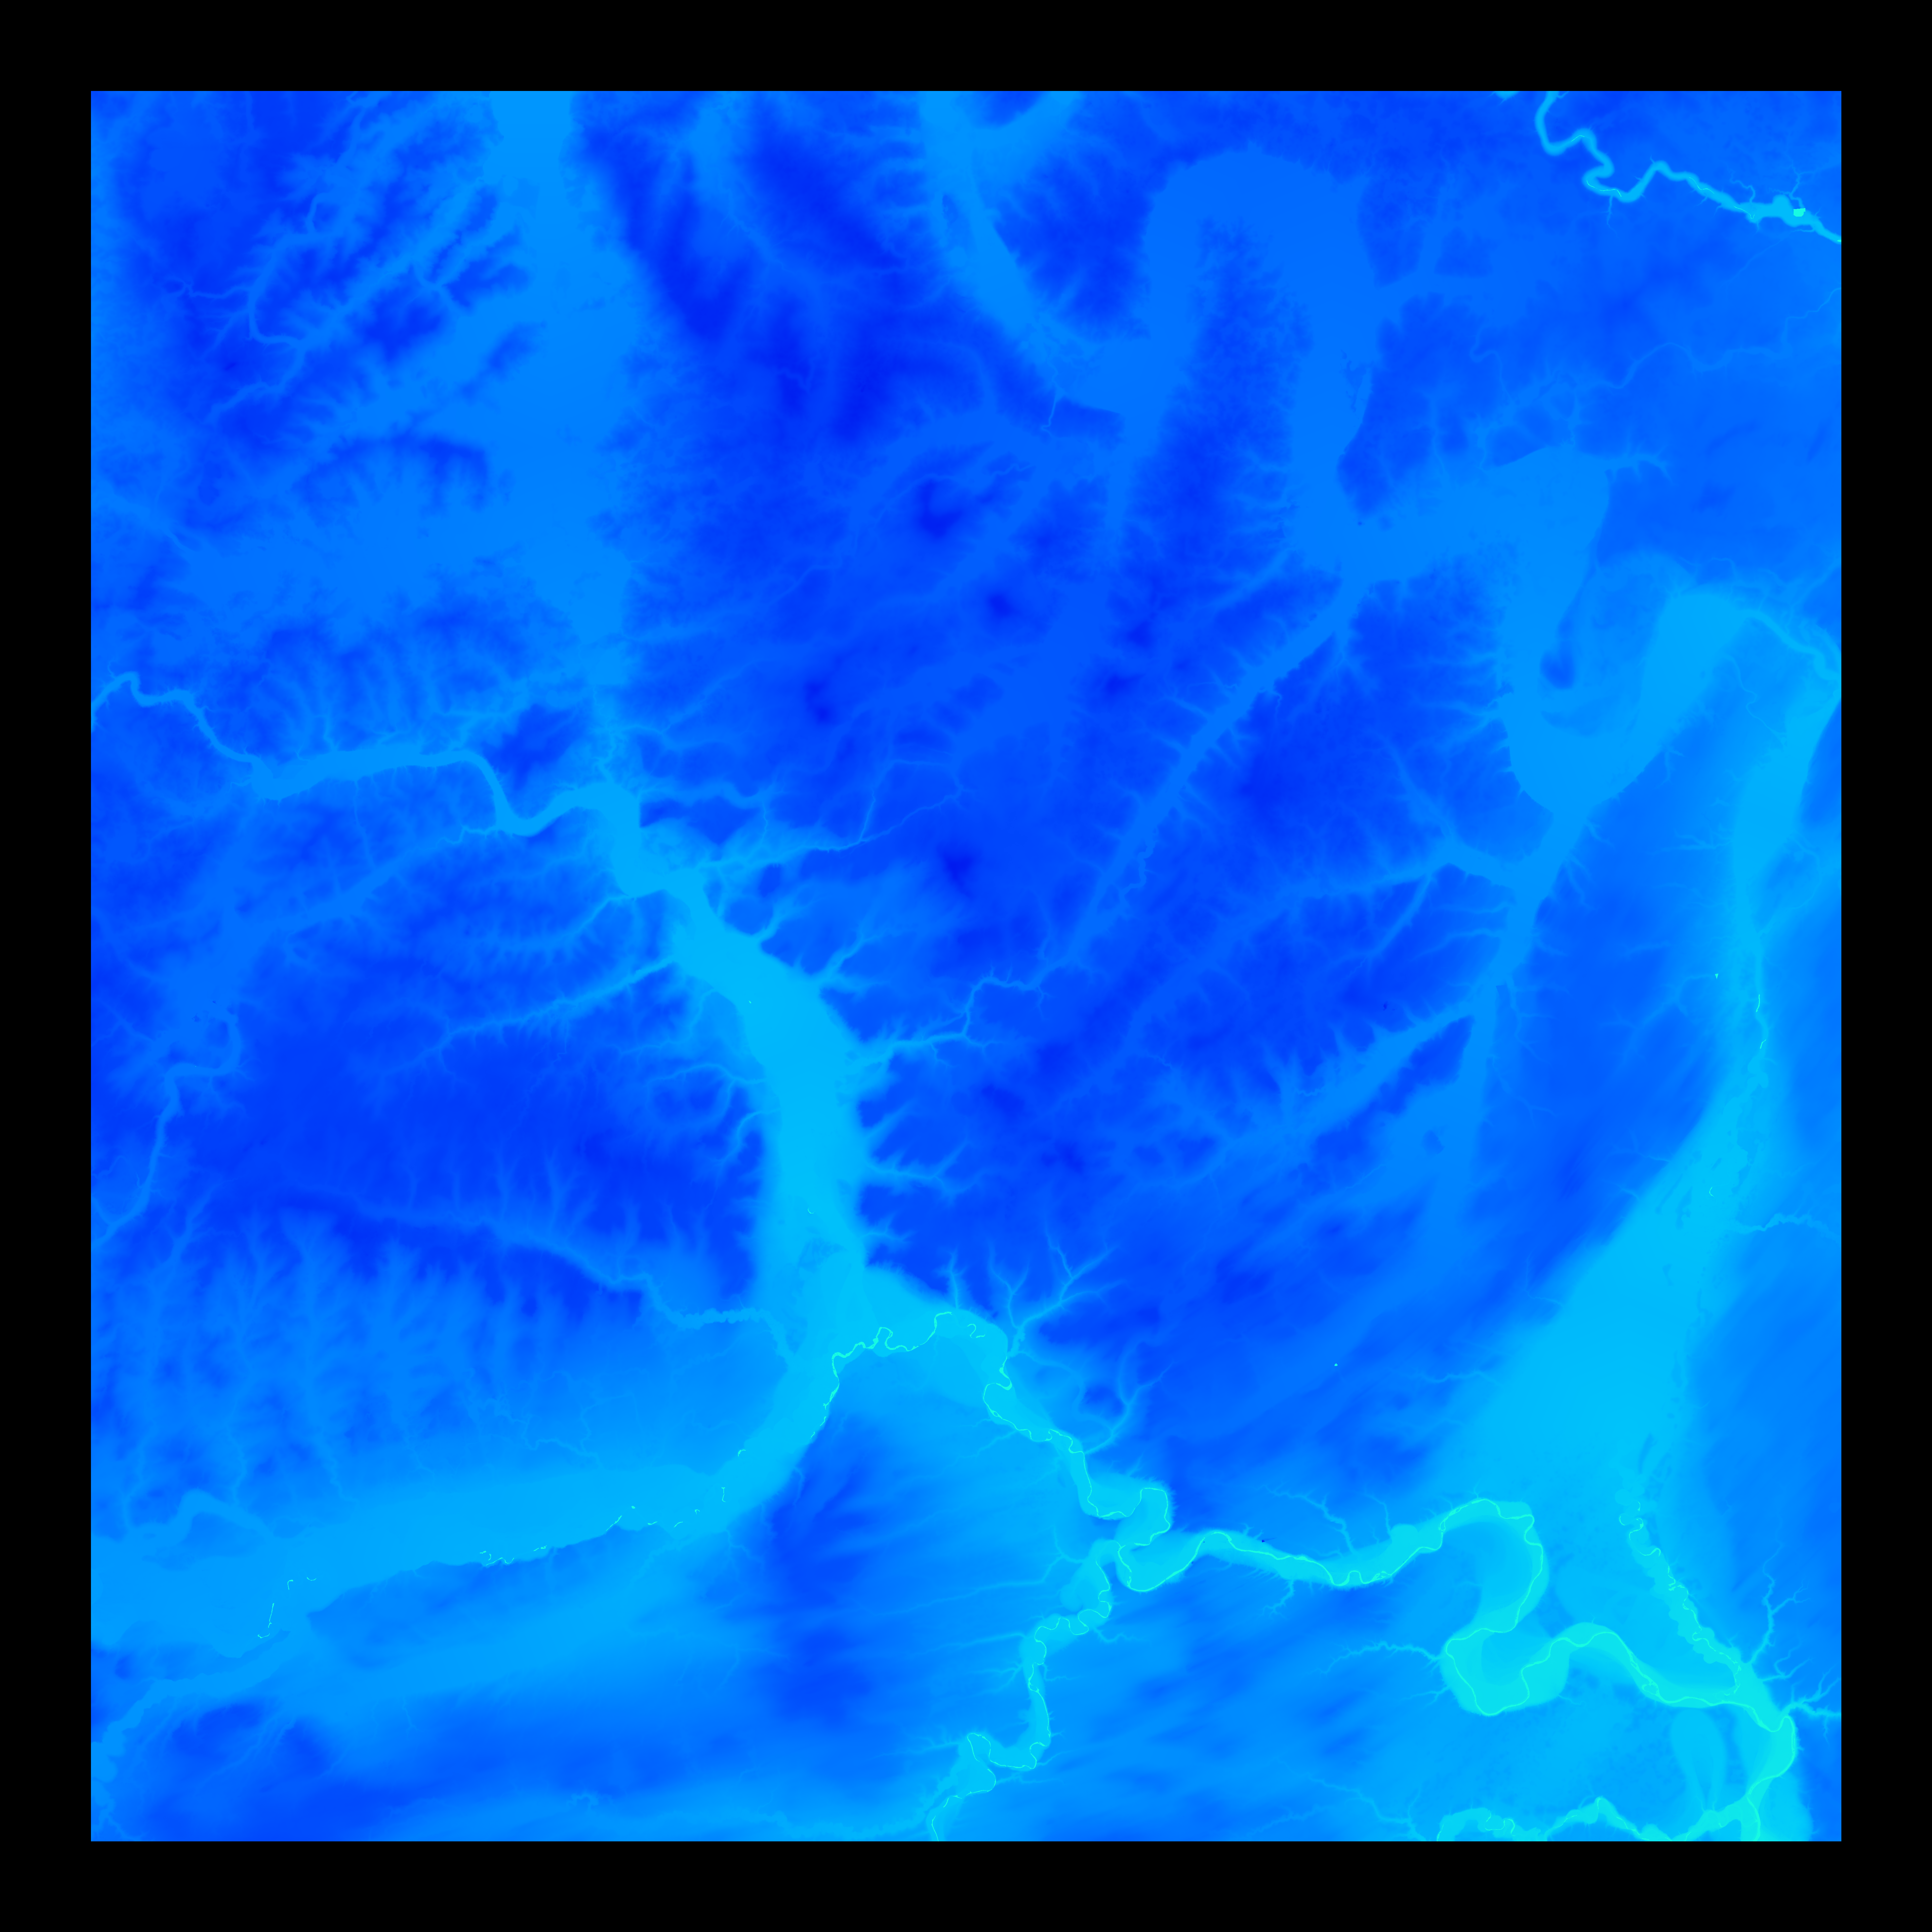
Nice blue color scale. A section of Glen Canyon (Utah and Arizona), and a zone in North Canada.
Data: USGS Glen Canyon, Canada Open Maps
Tags: #QGIS
Inspiration:
https://scihub.copernicus.eu/dhus/odata/v1/Products(‘7d55d260-e019-4658-abb2-46b5f83921cc’)/Products(‘Quicklook’)/$value
Styling elevation models in QGIS – making of
Challenges: Rendering a 900Mb elevation model, taken from USGS.
Source: Root, J.C., Hynek, S.A., DiViesti, D.N., and Gushue, T.M., 2019, Digital Elevation Model of Glen Canyon Prior to the Flooding of Lake Powell from Historic Topographic Surveys, Utah and Arizona: U.S. Geological Survey data release, https://doi.org/10.5066/P9368XHU
The data is a 2m resolution, pre-dam elevation model of Glen Canyon. It was more appropriate and easier to render only a section of the canyon, because the file was too big and I wanted to show only some details, anyway.
I have used QGIS to symbolize the raster data, and when choosing the colors I was influenced by a gorgeous image of the north-western Africa, from the Copernicus Open Access Hub (you can see it here if you are logged in).
Symbology->Band Rendering->Singleband pseudocolor->Band 1 (Gray)->Interpolation: Linear->Mode: Continuous-<Classes: 9# QGIS Generated Color Map Export File
INTERPOLATION:INTERPOLATED
964,23,250,226,255,964,0000
988,0,200,250,255,988,0000
1012,0,159,254,255,1012,0000
1037,1,123,255,255,1037,0000
1061,1,94,253,255,1061,0000
1085,0,70,251,255,1085,0000
1109,0,54,247,255,1109,0000
1132,0,39,243,255,1132,0000
1151.0987999999999829,0,27,239,255,1151,0988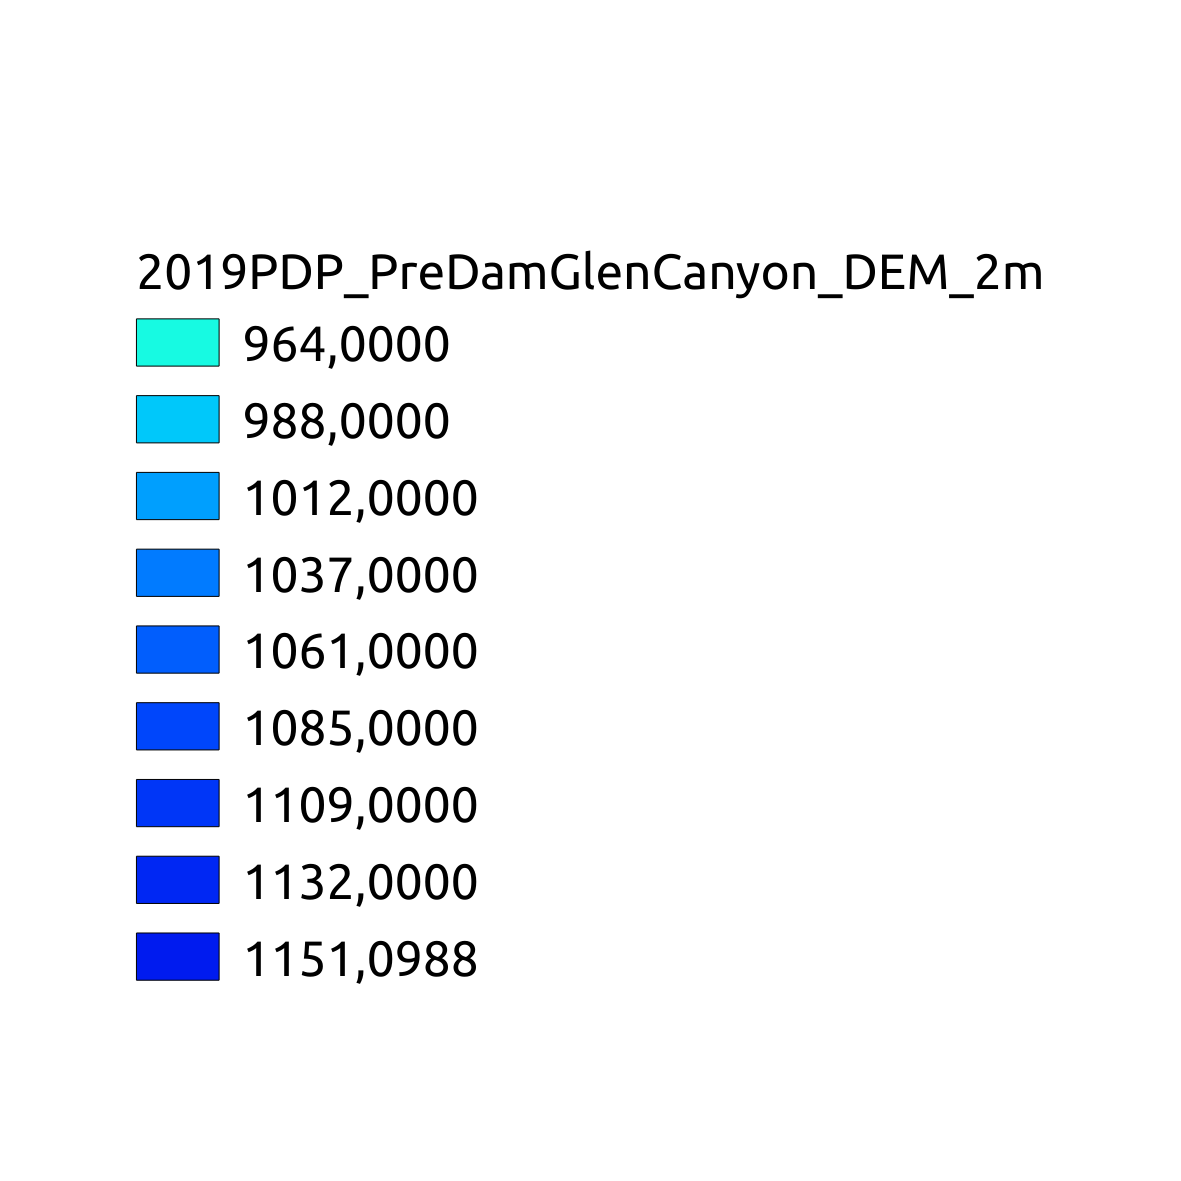
There was another map I have made, rendering a portion of a river system from Canada, too, but I don’t know exactly where it was located anymore.. 🙂
There is a rich collection of High Resolution Digital Elevation Models (HRDEM) – CanElevation Series at Canada OpenMaps, I must explore it more when I’ll have the time.
TODO: create tiles and show details by zoom level, fix pan.
To conclude, I think that this project aimed more to create an aestetically pleasing peace of work than a practical one, and I love the contrast created by the colors in this palette, so I will probably use it quite often in my future projects.
I also found new data sources for high resolution elevation models, useful resources on which I could perform interesting GIS analysis.
That being said, this was the making of for Blue scale 🔷